
TradingView vs Investing.com: Honest Comparison (2026)
This article contains affiliate links. If you sign up for TradingView through a link on this page, I may earn a commission at no extra cost to you. I only recommend tools I have genuinely evaluated.
Trading involves risk. Technical analysis tools do not guarantee profitable results. Past performance is not indicative of future results. Always manage your risk appropriately.
TradingView vs Investing.com is a comparison that comes up constantly among traders — and the honest answer is that these are not competing products in any meaningful sense. I am Andreas Maratheftis, and after 30 years in professional finance I have used both platforms regularly. TradingView is a charting and technical analysis platform built for traders. Investing.com is a financial data and news portal built for investors and market watchers. They overlap in a few areas, but they are optimised for fundamentally different workflows. This guide explains exactly what each platform does well, where each falls short, and which one — or which combination — makes sense for your situation.
Quick Answer
TradingView wins for technical analysis, charting, Pine Script automation, backtesting, and active trading workflows. Investing.com wins for economic calendar, financial news, fundamental data, and global market coverage — all available free. The comparison has an important nuance most articles miss: Investing.com’s own chart tool is explicitly powered by TradingView’s technology. If you need serious charting, you are better off going directly to the source. If you need macro data, news, and economic events to complement your charts, both tools together cost nothing at the free tier.
The Key Fact Most Comparisons Miss
Before comparing features, there is one fact that reframes the entire discussion. Investing.com does not have its own proprietary chart engine. Their live charts section carries the explicit label: “Powered by TradingView.”
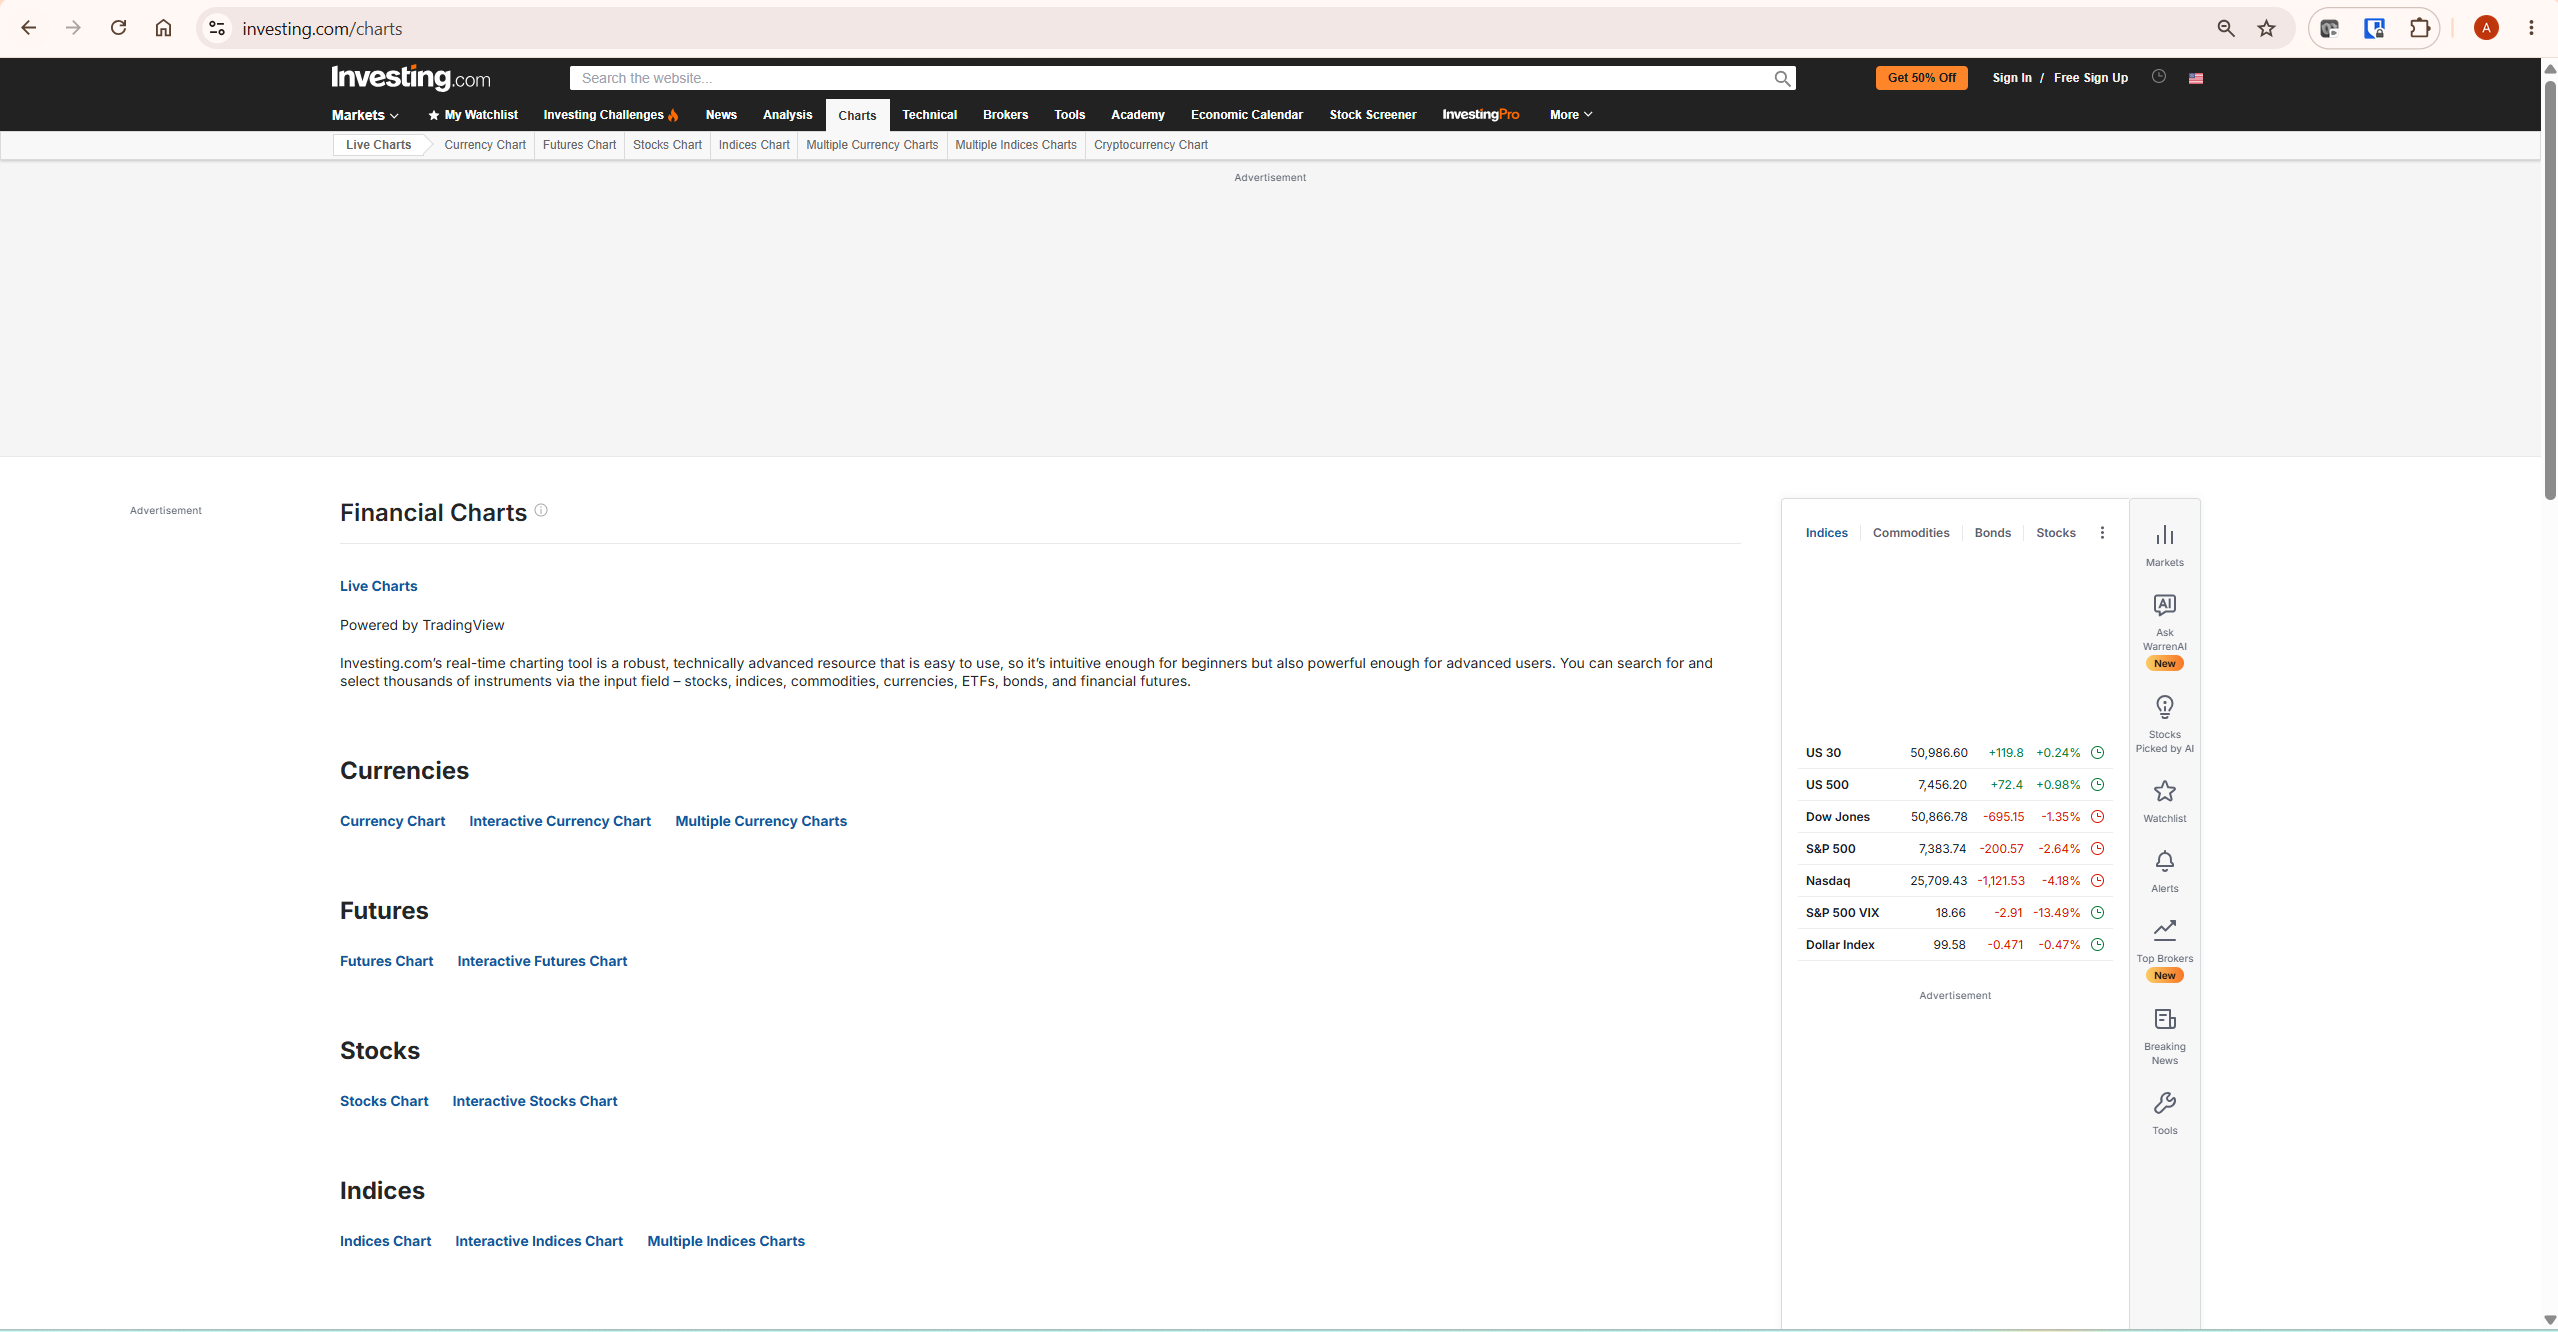
This matters for the comparison in a practical way. When traders ask whether Investing.com’s charts are “as good as TradingView,” the answer is that they are built on the same engine — but with fewer indicators, fewer drawing tools, no Pine Script access, and no multi-chart layouts. You are using a simplified version of TradingView’s technology when you chart on Investing.com.
The real comparison, then, is not chart engine vs chart engine. It is: which platform’s complete feature set serves your workflow better?
TradingView vs Investing.com: Side-by-Side Comparison
| Feature | TradingView | Investing.com | Verdict |
|---|---|---|---|
| Charting engine | Full platform — 400+ indicators, 110+ drawing tools, multi-chart layouts, custom timeframes | Powered by TradingView — simplified wrapper with fewer options | TradingView |
| Pine Script / custom indicators | Full Pine Script v6 — build, test, and publish custom indicators and strategies | Not available | TradingView |
| Backtesting | Built-in Strategy Tester with full performance metrics | Not available | TradingView |
| Paper trading | Available on all plans including free | Not available | TradingView |
| Alerts | Price, indicator, drawing, and Pine Script alerts — up to 1,000 on Ultimate | Basic price alerts available free | TradingView |
| Economic calendar | Available — embedded in charts on paid plans | Comprehensive — real-time updates, impact ratings, forecasts, historical data | Investing.com |
| Financial news | News feed available — secondary to charting | Core feature — real-time aggregated news across 44 language editions | Investing.com |
| Fundamental data | Basic financials on paid plans | Extensive on free plan — earnings, dividends, analyst forecasts, insider data | Investing.com |
| AI stock research | Not available | InvestingPro — WarrenAI chatbot, Fair Value estimates, ProPicks AI strategies | Investing.com (Pro) |
| Broker integration | Direct trading through connected brokers | Not available — links to brokers only | TradingView |
| Instruments covered | 3.5M+ instruments across hundreds of data feeds | 300,000+ instruments across 250 exchanges | TradingView (volume); Investing.com (breadth of data types) |
| Free plan quality | Genuinely useful — 3 indicators, basic alerts, full chart access | Excellent — real-time quotes, news, calendar, screener, portfolio tools all free | Tie — both have strong free tiers |
| Mobile app | Full charting, alerts, social feed — iOS and Android | News-focused, strong economic calendar, watchlists — iOS and Android | Tie — different strengths |
TradingView: What It Does That Investing.com Cannot
TradingView is the stronger platform for any workflow that involves active chart analysis, indicator-based decisions, or automated strategy testing. The features that have no equivalent on Investing.com are worth naming clearly.
Pine Script is TradingView’s proprietary scripting language. It allows traders to write custom indicators, build strategy logic, set precise alert conditions, and publish scripts for the community. For traders new to technical analysis, Investopedia covers the foundational concepts clearly. There are over 100,000 community-published Pine Script indicators in the public library — free to use without writing a single line of code. Investing.com has nothing comparable. If you need a custom RSI variant, a specific moving average crossover strategy, or an alert that fires only when three conditions align simultaneously, Pine Script is the only way to build it on a web-based charting platform.
The Strategy Tester lets you run a Pine Script strategy against historical data and measure its performance metrics — net profit, max drawdown, win rate, profit factor. This is proper backtesting, not a simplified overlay. For traders who want to validate a system before risking capital, this feature alone justifies the TradingView subscription. Our full guide to the TradingView Strategy Tester covers this in detail.
Multi-chart layouts allow you to run 2, 4, 8, or 16 charts simultaneously in a single tab depending on your plan. Running BTC/USD on a 4H, 1H, and 15M chart simultaneously while watching EUR/USD is a standard professional workflow. TradingView’s multi-chart workspace is far richer — Investing.com does offer multiple currency and indices chart pages, but these are separate pages rather than a unified multi-instrument workspace with linked layouts.
Volume Profile indicators — including Visible Range, Session, Fixed Range, and Anchored Volume Profile — are built into TradingView from the Essential plan upward. These are institutional-level tools for identifying price levels where significant volume traded. They do not exist on Investing.com’s chart wrapper. For a full guide, see our TradingView Volume Profile guide.
Direct broker integration allows placing live trades directly from a TradingView chart through connected brokers. Investing.com links to brokers but does not support in-platform trade execution.
Investing.com: What It Does That TradingView Cannot
Investing.com is the stronger platform for macro awareness, fundamental research, and staying current with market-moving events. These are not areas where TradingView is trying to compete.
The Economic Calendar is Investing.com’s signature feature and one of the most widely used free macro reference tools among traders. It aggregates every significant scheduled macro event globally — NFP, CPI, central bank decisions, GDP releases, earnings announcements — with impact ratings, consensus forecasts, and actual vs previous comparisons. It updates in real time and is available completely free. TradingView has a calendar feature embedded in charts on some plans, but it is noticeably less comprehensive and less used among professionals than Investing.com’s.
Financial news aggregation at scale is another area where Investing.com leads. With 44 language editions and content from Reuters, Bloomberg feeds, and regional sources, news reaches the platform faster and in more formats than TradingView’s news feed. For traders who need to understand why a price moved — not just that it moved — Investing.com is the better tool.
Fundamental data depth on the free plan covers earnings history, dividend data, analyst price targets, insider transactions, 13F filings, and company financials for tens of thousands of stocks globally. On TradingView, comparable fundamental data requires a paid plan. For investors researching stocks rather than trading them, Investing.com’s free tier delivers significantly more value.
InvestingPro adds AI-powered stock research tools that have no equivalent on TradingView. The WarrenAI chatbot answers questions about specific stocks and screens, ProPicks AI strategies select stocks algorithmically, and Fair Value estimates use 17 valuation models to assess whether a stock is over or undervalued. These are fundamentally different tools from anything TradingView offers — they are investment research tools, not charting tools.
Pricing Comparison
Both platforms have genuinely useful free tiers. The paid plans serve different purposes entirely.
| Plan | Platform | Price (Annual) | What You Get | Best For |
|---|---|---|---|---|
| Basic | TradingView | Free | Full charting, 3 indicators, 3 price alerts, 1 chart per tab | Learning the platform, casual chart viewing |
| Essential | TradingView | €12.95/mo billed annually | 5 indicators, 20 alerts, Bar Replay, Volume Profile, webhooks | Active traders needing core paid features |
| Plus | TradingView | €29.95/mo billed annually | 10 indicators, 100 alerts, multi-condition alerts, 4 charts per tab | Traders running multiple instruments simultaneously |
| Premium | TradingView | €59.95/mo billed annually | 25 indicators, 400 never-expiring alerts, 8 charts per tab, second-based alerts | Active day traders and serious technical analysts |
| Free | Investing.com | Free | Real-time quotes, news, economic calendar, screener, portfolio, basic charts | Macro awareness, news, fundamental research |
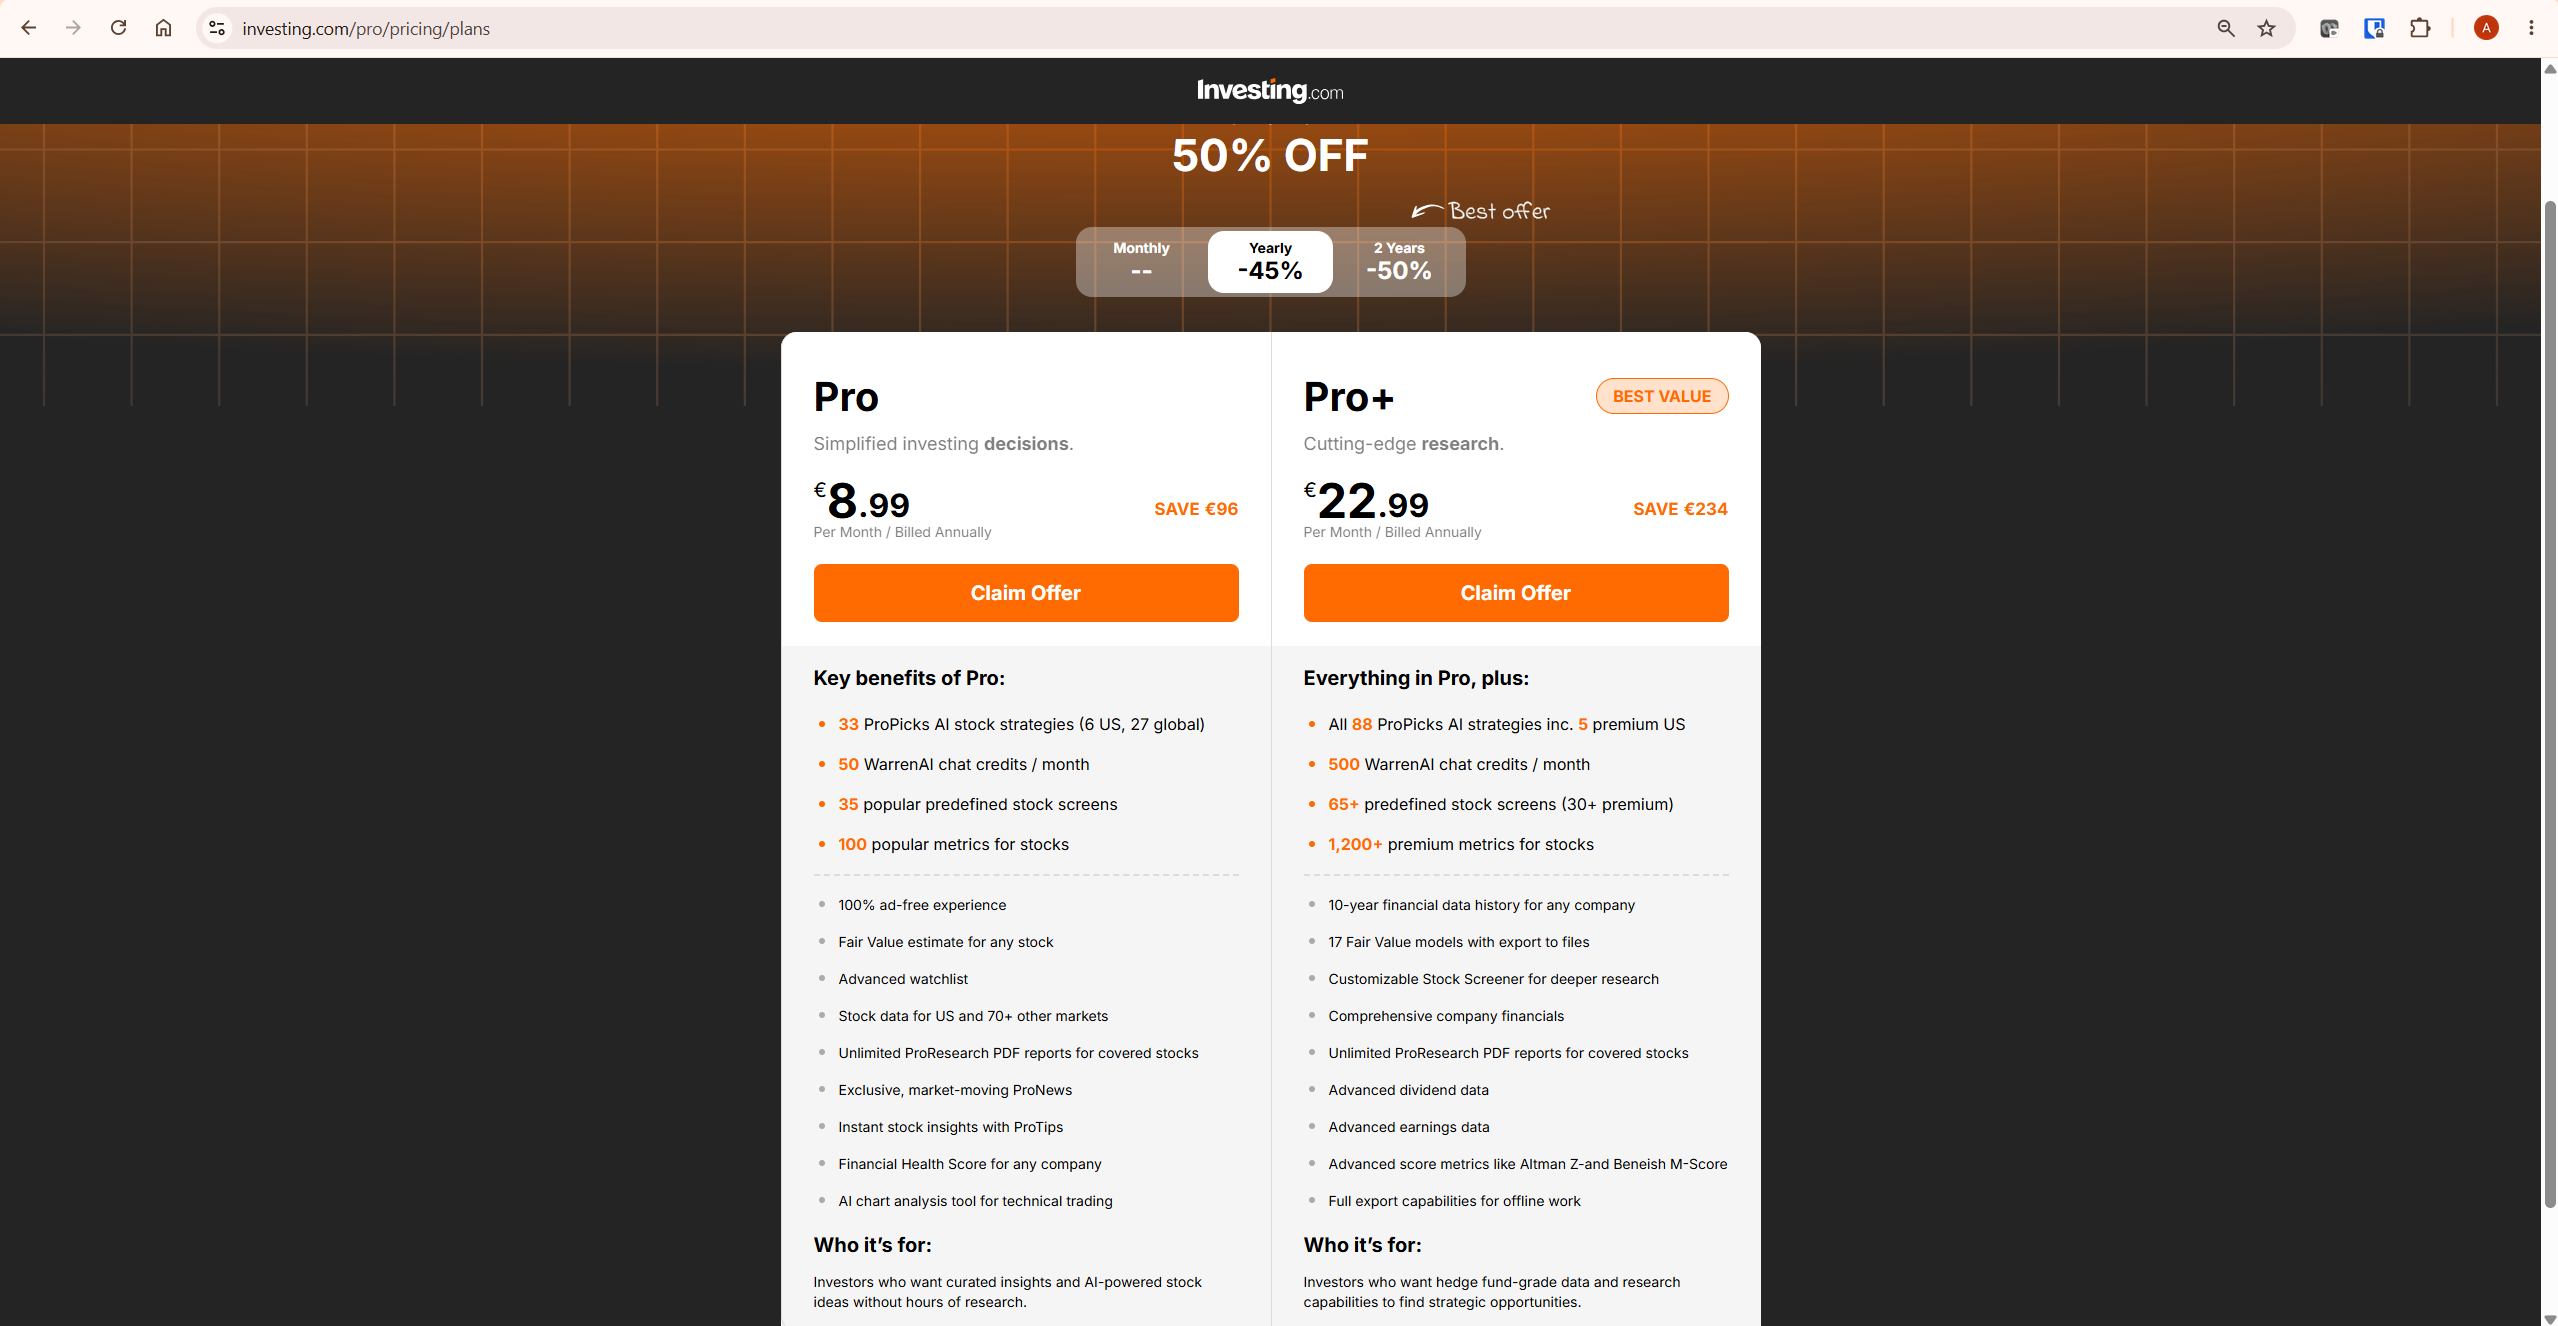
| InvestingPro | Investing.com | From €8.99/mo billed annually (promotional) | AI stock picks, WarrenAI chatbot, Fair Value estimates, 100 metrics, ad-free | Stock investors wanting AI-assisted research |
| InvestingPro+ | Investing.com | From €22.99/mo billed annually (promotional) | 1,200+ metrics, 17 Fair Value models, 88 AI strategies, advanced screener | Professional investors doing deep fundamental research |
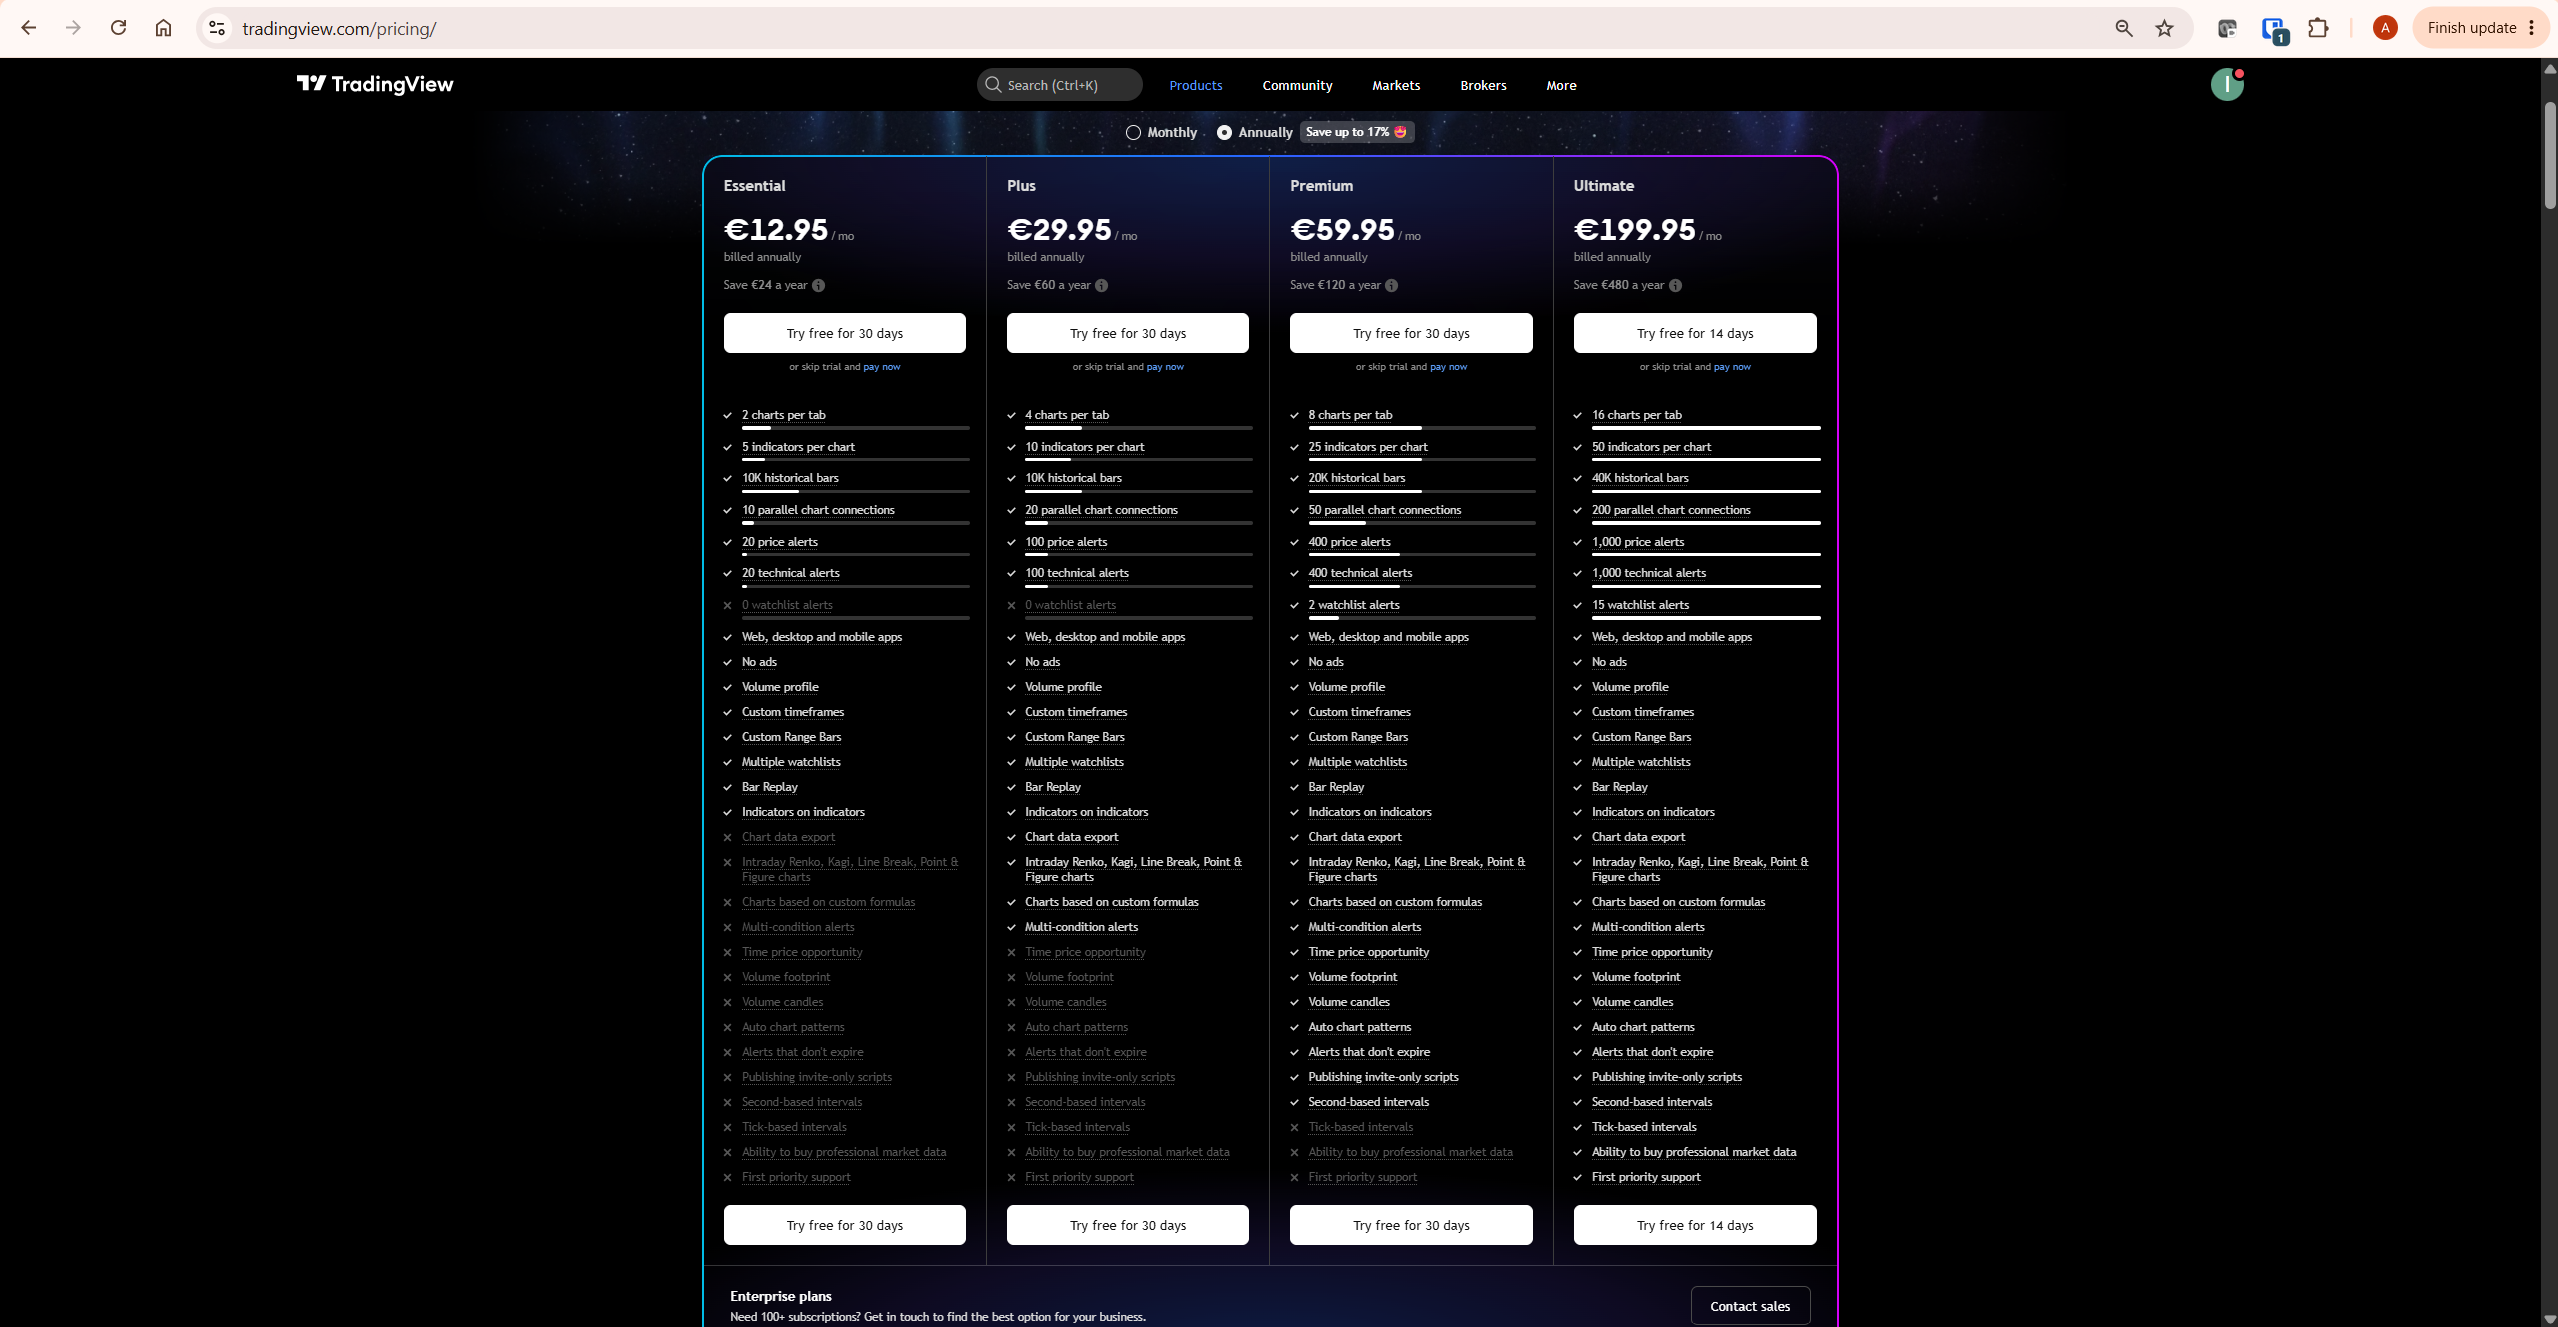
TradingView pricing is shown in euros as displayed for European accounts. Always verify current pricing at tradingview.com/pricing and investing.com/pro/pricing — both platforms update their prices and run promotions regularly.
Who Should Use TradingView
TradingView is the right primary platform if technical analysis drives your decisions. That means crypto traders reading chart patterns and indicators, forex traders running multi-timeframe analysis, stock traders using Pine Script screeners and alert systems, and anyone who backtests strategies before deploying capital.
For affiliate marketers building content sites in the trading space — which is the primary audience of InnovateHub Finance — TradingView is the platform I use and recommend. The chart quality, the community indicator library, and the alert system make it the right tool for anyone whose content or analysis involves technical trading.
TradingView is not the right primary platform if your main need is macro economic data, fundamental stock research, or AI-powered investment ideas. It can supplement those workflows but it is not built for them.
One specific audience worth naming directly: traders who follow crypto markets across multiple timeframes. TradingView connects to Binance, Bybit, Coinbase, and other major exchanges for real-time data, and the crypto community on TradingView is one of the most active publisher communities on the platform — thousands of annotated Bitcoin and altcoin charts are published daily. For crypto traders specifically, TradingView is the strongest web-based charting platform available across any price tier. Investing.com covers crypto prices and news, but its chart tool cannot replicate what TradingView offers for multi-timeframe crypto analysis.
Who Should Use Investing.com
Investing.com is the right primary platform if you are a long-term or value-focused investor rather than an active trader. Its strength is breadth — 300,000+ instruments, 44 languages, deep fundamental data, and one of the most comprehensive free economic calendars available. For someone who checks earnings, tracks dividends, follows analyst ratings, and monitors macro events, Investing.com’s free tier delivers more value than anything TradingView offers at the same price point.
The InvestingPro paid tier makes most sense for stock investors who want AI-powered stock screening and research. It is not relevant to technical traders — there are no charting upgrades, no additional indicators, and no Pine Script access in InvestingPro. It is purely a fundamental and AI research tool. For traders evaluating whether InvestingPro adds value to their workflow, the honest answer is almost always no — unless fundamental stock analysis is a core part of their process rather than an occasional reference.
The Professional Workflow: Using Both
Most serious traders use both platforms simultaneously, and there is no cost barrier to doing so — both have strong free tiers. The workflow is straightforward: Investing.com for macro context before the session opens, TradingView for chart analysis and trade execution during the session.
Check the Investing.com economic calendar every morning before opening TradingView. Know what macro events are scheduled, which ones have high market impact, and at what time they land. Then open TradingView, run your chart analysis, and set your alerts. When a news event hits on Investing.com, you can immediately assess its impact on the price levels you have already identified on TradingView.
This is not a workaround — it is how professional trading desks operate. Macro context and technical analysis are complementary disciplines, and the tools that serve each are different. After 30 years in finance, the traders I have seen fail most often are the ones who ignore one side of that equation entirely. Pure technicians get stopped out by macro events they did not see coming. Pure fundamentalists miss entry and exit precision that chart analysis provides.
A practical example: suppose you have identified a key resistance level on TradingView’s BTC/USD chart at a significant high volume node. You have set an alert to fire if price reaches that level. Before acting on the alert, checking Investing.com’s calendar tells you whether a high-impact macro event — Federal Reserve statement, CPI release, major earnings — is scheduled within the next few hours. The same price level behaves very differently in a low-volatility pre-market session versus the 30 minutes following a surprise inflation print. The chart tells you the level. The calendar tells you the context. Neither tool alone gives you the complete picture.
Honest Limitations of Each Platform
TradingView’s free plan is deliberately limited. Three indicators per chart is workable for basic analysis but restricts any serious multi-indicator workflow. The platform also has no fundamental data depth on lower plans, and customer support is widely criticised as slow across all tiers. For traders who need institutional-quality order flow data or Level II depth of market, TradingView is not the right tool — platforms like ATAS or cTrader serve that use case better.
Investing.com’s free tier carries advertising, which can be intrusive on the desktop interface. The chart tool, while powered by TradingView, is a simplified implementation — it functions, but if you actually want to do serious technical analysis rather than check a price, you will quickly hit its limits. The InvestingPro pricing also varies significantly by region and promotion, which makes it difficult to evaluate the cost-benefit without checking the current price directly on their site.
For a complete assessment of TradingView’s full feature set and plan structure, see our TradingView Review. The independent StockBrokers.com TradingView review also provides a useful third-party perspective on the platform’s strengths and limitations.
What To Do Next
Open a free account on both platforms today — there is no cost and no commitment required. Spend one week using Investing.com’s economic calendar before each trading session and TradingView’s charts during it. After that week you will have a direct, first-hand answer to which combination of features you actually use — and whether any paid upgrade makes sense for your specific workflow.
Create your free TradingView account here — no credit card required to start.
Related TradingView Guides
- TradingView Review 2026 — complete platform assessment including honest limitations
- TradingView Free vs Paid — full plan comparison with alert limits, indicator counts, and feature breakdown
- TradingView Alerts Explained — how to set up alerts across price, indicators, and Pine Script conditions
- TradingView Screener — how to find trading opportunities using TradingView’s built-in screener
- TradingView Strategy Tester — how to backtest trading strategies using Pine Script
Frequently Asked Questions
Is TradingView better than Investing.com?
For charting and technical analysis, yes — TradingView is significantly more capable. It has 400+ built-in indicators, Pine Script for custom strategies, a full backtesting engine, multi-chart layouts, and direct broker integration. For economic calendar, financial news, and fundamental data, Investing.com is stronger and provides more of these features free. The two platforms serve different primary purposes, and most serious traders use both.
Does Investing.com use TradingView charts?
Yes. Investing.com’s live chart tool is explicitly labelled “Powered by TradingView” on their Charts page. Their charting capability is built on TradingView’s technology, but implemented with more limited options — there is no Pine Script access, no custom indicator scripting, and no unified multi-chart workspace. If you need full chart functionality, using TradingView directly gives you access to the complete platform rather than the simplified version.
Is Investing.com free?
Yes. The core Investing.com platform is free, including real-time quotes, news, the economic calendar, stock screener, portfolio tracker, and basic charts. The paid InvestingPro tier adds AI stock research tools, Fair Value estimates, and ad-free access — but the free tier is genuinely comprehensive for market data and news purposes.
Which is better for crypto trading — TradingView or Investing.com?
TradingView is significantly better for crypto trading. It connects directly to major crypto exchanges including Binance, Coinbase, and Kraken for real-time data, supports crypto-specific indicators and Pine Script strategies, and allows direct crypto trading through connected brokers. Investing.com covers cryptocurrency market data and news but its chart tool is the simplified TradingView wrapper — not suitable for serious crypto technical analysis.
Can I use both TradingView and Investing.com together?
Yes, and this is how most professional traders operate. Use Investing.com’s economic calendar and news feed for macro context before and during trading sessions. Use TradingView for chart analysis, indicator-based decisions, and alerts. Both platforms have strong free tiers, so running them simultaneously costs nothing. The combination covers technical analysis and macro awareness — two disciplines that work best together.
Does TradingView have an economic calendar?
TradingView includes an economic calendar that can be embedded in charts, but it is less comprehensive than Investing.com’s calendar. TradingView’s calendar covers major scheduled events, but Investing.com’s version has broader coverage, more granular impact ratings, historical actuals vs forecasts, and is the most widely used free reference for macro event tracking among active traders. For economic calendar purposes specifically, Investing.com is the stronger tool.
What is InvestingPro and is it worth it?
InvestingPro is Investing.com’s paid subscription tier, offering AI-powered stock research tools including WarrenAI (an AI chatbot for stock questions), ProPicks (AI-selected stock strategies), Fair Value estimates using 17 valuation models, and 100–1,200+ company metrics depending on the plan. It is aimed at stock investors doing fundamental research — not at technical traders. For traders whose primary workflow is chart-based, InvestingPro adds little value. For investors evaluating individual stocks, it provides data depth that goes well beyond what is available free. Always verify current InvestingPro pricing at investing.com/pro/pricing as prices and promotions change regularly.
Trading disclaimer: Trading involves risk. Technical analysis tools do not guarantee profitable results. Past performance is not indicative of future results. Always manage your risk appropriately.
