
TradingView Review 2026: Is It the Best Charting Platform for Crypto?
This article contains affiliate links. If you sign up for TradingView through a link on this page, I may earn a commission at no extra cost to you. I only recommend tools I have genuinely evaluated.
Trading involves risk. Technical analysis tools do not guarantee profitable results. Past performance is not indicative of future results. Always manage your risk appropriately.
Last verified: July 2026, using TradingView’s official documentation and pricing page.
TradingView is worth paying for if you trade more than one asset regularly or use more than three indicators — the free plan will start blocking your workflow within weeks. I am Andreas Maratheftis, and after 30 years working in professional finance, this TradingView review gives you the straight verdict most reviews avoid: exactly where the platform earns its price, where it falls short, and which plan actually fits how you trade.
The question that matters is not “what features does TradingView have?” — that is on their website. The question is whether it solves the specific analysis problems that matter for the way you trade, and whether the paid upgrade is worth the cost at your stage. This review answers both directly.
If you do not yet have an account, the free plan is a genuine starting point — not a crippled demo. Get started with TradingView’s free plan here.
Key Takeaways
- TradingView’s free plan covers one chart, three indicators, and a limited number of alerts — genuinely usable for beginners, restrictive for active traders.
- The single highest-value paid upgrade is multi-chart layouts, which unlock proper multi-timeframe analysis (daily / 4H / 1H simultaneously).
- TradingView is an analysis platform, not an execution terminal — you analyse here and place trades on your exchange or connected broker.
- Pine Script is available on every plan, including free, and gives access to tens of thousands of community-built indicators at no cost.
- Crypto data is generally live and free across major exchanges; some stock market data requires separate subscriptions.
- Overall rating: 4.7/5 — strongest for traders whose edge comes from chart analysis, weakest for anyone wanting integrated order execution.
TradingView Rating Summary
| Category | Rating |
|---|---|
| Overall | 4.7 / 5 |
| Charting Quality | 5 / 5 |
| Indicator Library | 5 / 5 |
| Crypto Coverage | 5 / 5 |
| Execution Capability | 3 / 5 |
| Value for Money | 4 / 5 |
Quick Answer: TradingView Review Summary
TradingView is one of the strongest retail charting platforms available, combining professional-grade technical analysis with a genuinely usable interface. The free plan suits beginners and casual traders. Active traders using multi-timeframe analysis or more than three indicators will find the paid plans worth it. The honest limitation: it is an analysis platform, not an execution terminal — you analyse here, you trade elsewhere.

TradingView at a Glance: Quick Comparison Snapshot
Before the detailed breakdown, here is how TradingView stacks up against the platforms traders most often compare it to.
| Tool | Best For |
|---|---|
| TradingView | Chart analysis, multi-timeframe workflow, crypto coverage across exchanges |
| Binance Charts | Quick price checks inside the exchange app |
| MetaTrader | Automated forex and CFD execution |
| Thinkorswim | Options traders wanting integrated analytics and execution |
What Is TradingView and Who Uses It?
TradingView is a web-based charting and market analysis platform used by over 100 million traders and investors worldwide. It was built specifically for technical analysis: reading price charts, identifying patterns, applying indicators, and making decisions based on what price has done and where it might go. Unlike broker platforms built around execution, TradingView is built around analysis first.
Market Coverage
The platform covers virtually every tradeable market: cryptocurrencies from every major exchange, global stocks and ETFs, forex pairs, commodities, indices, and futures. For crypto traders, the multi-exchange data aggregation is one of the most valuable aspects of this TradingView review — you can view Bitcoin price data from Binance, Bybit, Coinbase, and OKX simultaneously, selecting whichever exchange feed is most relevant to where you actually trade.
Who Actually Uses It
- Day traders use 5-minute and 15-minute charts for intraday setups.
- Swing traders use 4H and daily charts to identify multi-day opportunities.
- Long-term investors use weekly and monthly charts to assess macro trends.
- Crypto traders monitor dozens of altcoins with alerts, often built using the TradingView Screener to scan the market rather than checking assets one at a time.
- Professional analysts use Pine Script to build proprietary tools beyond the standard indicator library.
Charting and Technical Analysis
The charting interface is the core of what TradingView does and the main reason traders choose it over alternatives. Charts are fast, responsive, and genuinely pleasant to use — zooming, panning, and switching timeframes all feel fluid in a way competing platforms do not consistently match.
Chart Types and Indicators
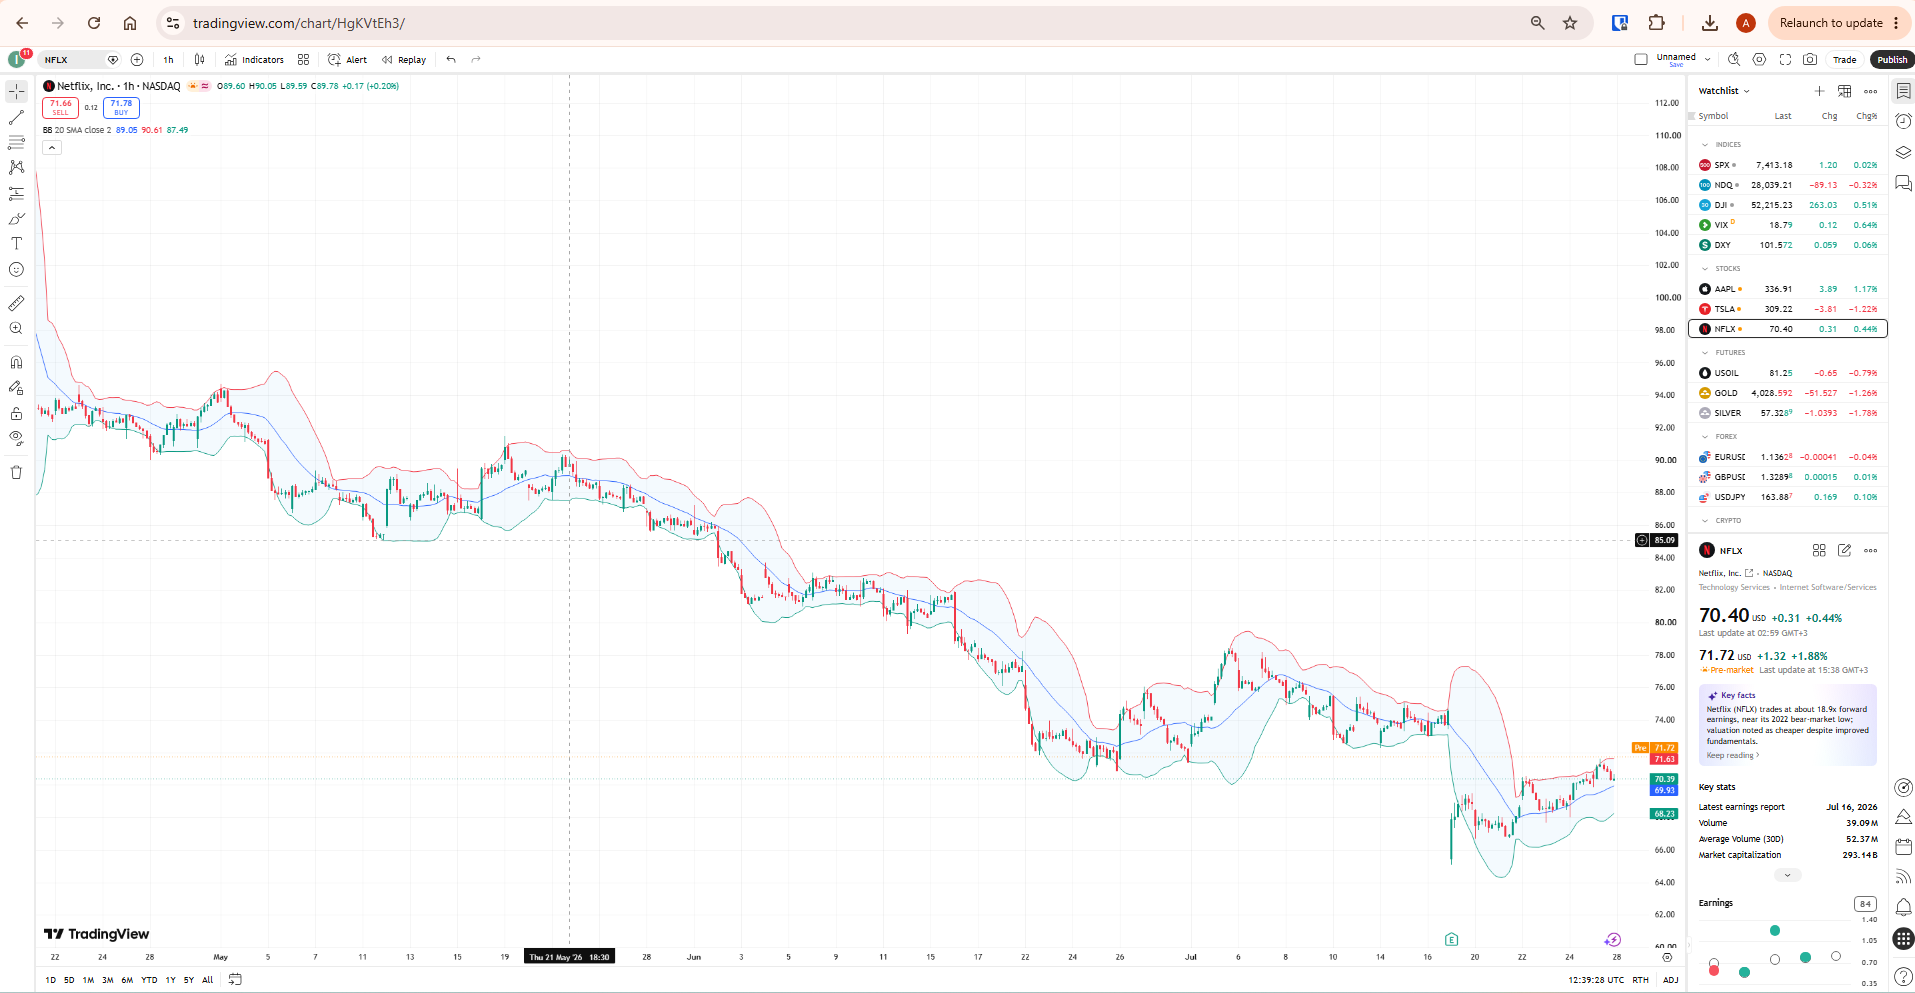
The chart library supports candlestick, bar, line, area, Heikin Ashi, Renko, Point and Figure, and Kagi chart types — covering every analysis methodology from standard price action through advanced non-linear techniques. The built-in indicator library contains over 100 standard technical indicators — RSI, MACD, Bollinger Bands, all moving average types, volume indicators, and oscillators. Every indicator is customisable: periods, colours, line styles, and alert triggers.
Drawing Tools
The drawing tool library is comprehensive: trendlines, horizontal and vertical lines, channels, Fibonacci retracements and extensions, pitchforks, Gann tools, and pattern recognition shapes — all saved automatically to your chart layout. Traders working with wave-based analysis can also access dedicated tools covered in my TradingView Elliott Wave guide. Drawings can be set to trigger alerts when price interacts with them, which is far more useful than manually updating a price alert every time a trendline value changes. For the complete reference, my TradingView drawing tools guide covers every tool in detail.
For a complete walkthrough of building a practical chart setup from scratch, my guide on how to use TradingView for crypto trading covers the full process step by step.
Which Indicators Actually Work for Crypto
Three indicators provide the highest signal-to-noise ratio for crypto trading: the Exponential Moving Average (EMA) for trend direction, RSI for momentum and overbought/oversold conditions, and MACD for trend confirmation. These three cover trend, momentum, and timing — the core information needed for most trading decisions. Everything else is supplementary until you can read these three fluently across multiple timeframes. For volume-based confirmation alongside these three, my TradingView Volume Profile guide covers a deeper layer of analysis once the basics are solid.
Pro tip: The free plan’s three-indicator limit is not a real constraint for most traders. EMA, RSI, and MACD together already cover trend, momentum, and timing. Traders who add ten indicators to a chart usually get worse signals, not better ones — simplicity reads price action more clearly than complexity does.
For specific indicator settings and an honest assessment of when each produces reliable signals versus noise, my best TradingView indicators for crypto trading guide covers RSI, EMA, and MACD with settings recommendations for each timeframe. External resources worth understanding alongside these tools: Investopedia’s RSI guide covers the calculation and interpretation in depth.
Alerts: The Most Underused Feature
TradingView’s alert system is consistently the most underused feature among traders who would benefit from it most. Alerts are server-side notifications that fire when specific market conditions are met — whether you have the platform open or not.
Alert Types and Delivery
Price alerts, indicator alerts, trendline alerts, and strategy alerts are all available. The alert creation dialog is clean and takes under a minute to configure. Notifications arrive via browser popup, email, or mobile app push notification. One alert that prevents a bad trade is usually worth more than checking charts twenty times a day.
Why This Matters for 24/7 Crypto Markets
Bitcoin trades 24 hours a day, seven days a week. Without alerts, you either miss opportunities that occur outside your active monitoring hours, or you develop an anxious habit of checking charts constantly — both produce worse trading outcomes than a well-configured alert system. The free plan includes a limited number of active alerts, workable for monitoring a small number of key levels. Paid plans expand this significantly, which matters for active traders monitoring multiple assets. For a complete setup guide, my TradingView Alerts explained guide covers every alert type. If alerts have stopped firing, my TradingView alerts not working guide covers common causes and fixes.
Multiple Charts, Watchlists, and Multi-Timeframe Analysis
Multi-timeframe analysis — checking the daily chart for trend context, the 4H for structure, and the 1H for entry timing — is one of the most reliable improvements any trader can make to their analysis quality. TradingView’s multi-chart layout feature makes this workflow significantly more efficient than manually switching between timeframe tabs.
The free plan is limited to one chart per layout, so this feature requires an upgrade. Higher plan tiers progressively unlock more charts per layout — check tradingview.com/pricing for current plan-by-plan limits. For most active traders, four charts covers the complete top-down analysis framework: daily trend context, 4H structure, 1H execution, and one correlation or context chart.
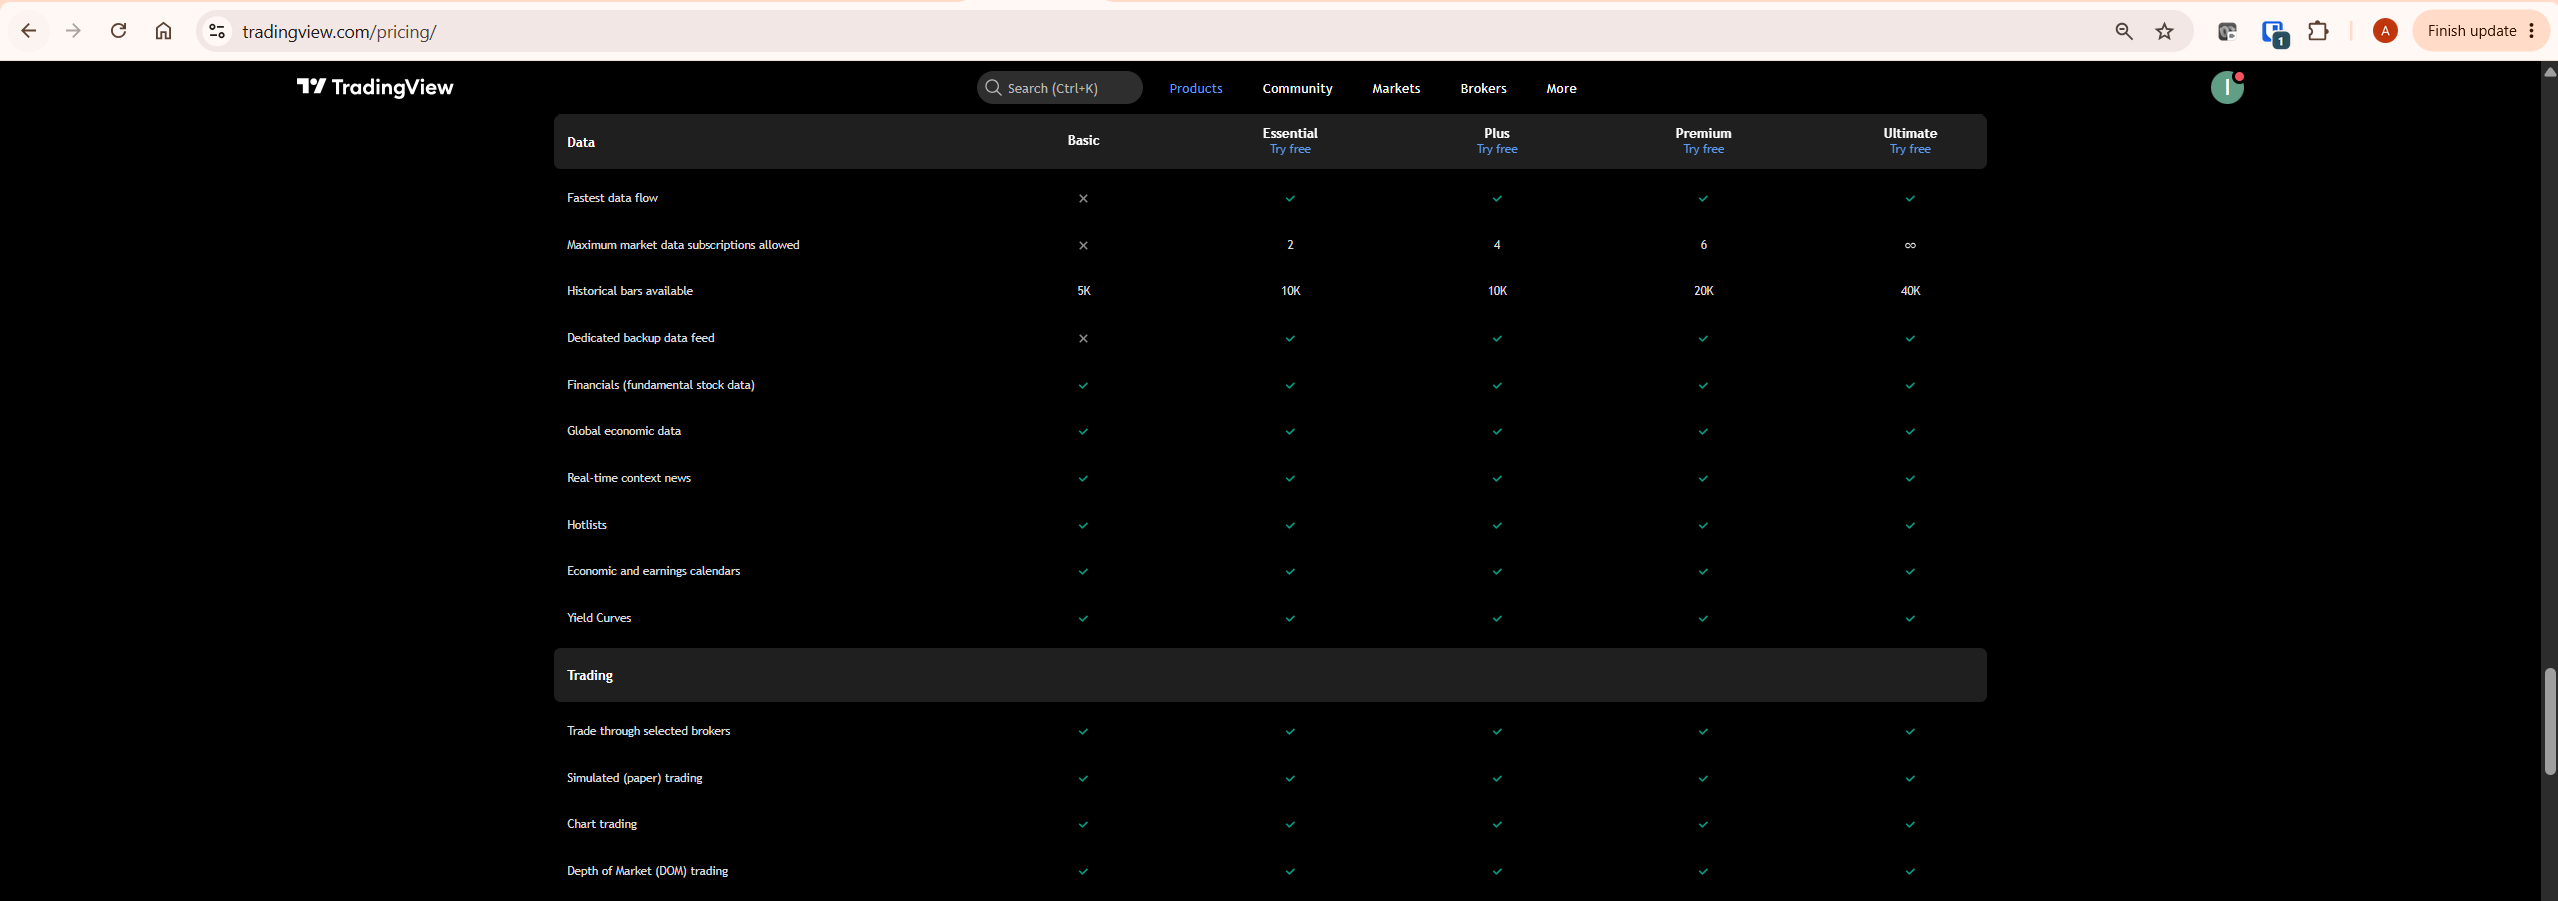
The multi-chart layout upgrade is the single most impactful paid feature for traders using multi-timeframe analysis. Seeing daily, 4H, and 1H simultaneously rather than switching between them reduces cognitive load per analysis session and makes chart context more visible. Organising the specific assets you track across these timeframes is easier with a properly configured TradingView Watchlist rather than re-searching tickers each session. For specific layout configurations, my guide on how to use multiple charts in TradingView covers setup, sync options, and workflow structures in full detail.
Pine Script and Custom Indicators
Pine Script is TradingView’s proprietary scripting language for building custom indicators, strategies, and libraries. It is available on all plans including the free tier, and represents the deepest analytical capability the platform offers. At its simplest, it lets you modify an existing community indicator’s settings or presentation. At its most advanced, it lets you build fully custom indicators encoding your specific trading logic — conditions, signals, and alerts no standard indicator can replicate. The public indicator library contains tens of thousands of community-built Pine Script indicators, many genuinely excellent and free.
For traders wanting to build their first custom indicator, my Pine Script tutorial covers the fundamentals with working code examples. Once you have a working indicator or strategy, the TradingView Strategy Tester guide covers how to backtest it against historical data before risking real capital.
Paper Trading and Strategy Testing
TradingView includes a paper trading feature that simulates trades using real market data without risking actual capital. Availability depends on plan and current TradingView offering — verify your specific access at tradingview.com/pricing. Where available, it is genuinely useful for testing a new strategy before committing real money.
The paper trading interface mirrors the real chart experience: you open and close positions, set stop losses and take profits, and track simulated portfolio performance over time. One honest limitation: paper trading performance does not always reflect live trading performance accurately, because market orders in paper trading fill at exactly the current price without accounting for slippage or liquidity constraints. Use it as a confidence-building tool, not definitive proof of strategy viability. For a detailed guide, my TradingView paper trading guide covers the setup and limitations in full.
Bar Replay for Practising Price Action
Bar Replay rewinds any chart to a historical point and replays price action bar by bar, simulating the experience of being in a trade without knowing what happens next. This is one of the most valuable training tools TradingView offers, and one of the least discussed in most reviews. For traders developing chart-reading skills, it provides a way to practise pattern recognition, entry timing, and trade management against real historical data without the psychological pressure of live markets. Bar Replay is available on paid plans. For a step-by-step walkthrough, my TradingView Bar Replay guide covers the complete workflow.
Free vs Paid Plans: The Honest Breakdown
The free plan includes access to all markets and price data, one chart per layout, three indicators per chart, a limited number of active alerts, one saved chart layout, and the full drawing tool library. Ads are displayed. Data updates are standard speed — not real-time for some stock markets, though crypto data is generally live.
When the Free Plan Is Genuinely Enough
- Beginners learning chart reading
- Casual traders checking a small number of assets occasionally
- Investors who need basic trend context
- Anyone testing whether TradingView fits their workflow before subscribing
When You Genuinely Need to Upgrade
- You regularly use more than three indicators
- You need multi-chart layouts for multi-timeframe analysis
- You monitor more than a handful of alert levels simultaneously
- You use Bar Replay or paper trading for practice and strategy development
According to StockBrokers.com’s independent TradingView review, the platform consistently ranks among the top charting solutions for retail traders across all asset classes. Always verify current plan pricing and limits at tradingview.com/pricing before upgrading, as pricing is updated periodically. If you decide to upgrade, explore TradingView’s current plan pricing here.
For a detailed comparison of exactly what each plan includes and which upgrade makes sense at different stages, my TradingView free vs paid guide covers the decision with specific milestone recommendations.
Working Out When an Upgrade Pays for Itself
Rather than a hard price figure that will go stale, here is the framework I use to decide whether a TradingView upgrade is worth it. Ask three questions: How many hours per week do you spend manually switching between timeframe tabs because you only have one chart? How often does a missed alert — because you hit the free plan’s active alert cap — cost you a trade you would have taken? And how many indicators do you genuinely reference before entering a position?
If the answer to the first question is “most sessions,” the multi-chart upgrade pays for itself in time saved alone. If the answer to the second is “more than once a month,” the alert cap is actively costing you opportunities. If the third answer is “three or fewer,” stay on the free plan — you are not paying for anything you would use. This is a framework, not a fixed number, because plan pricing changes; run your own numbers against your actual trading frequency at tradingview.com/pricing.
How TradingView Compares to Alternatives
No TradingView review is complete without honest context on how it compares to the alternatives most traders actually consider.
| Alternative | Best For |
|---|---|
| Binance Charts | Quick price checks within the exchange app |
| MetaTrader | Automated forex and CFD execution |
| Webull | US stock traders wanting integrated brokerage |
| Finviz | Stock screening and market-wide visualisation |
| NinjaTrader | Active futures execution |
| Thinkorswim | Options traders wanting integrated analytics |
| Investing.com | Casual investors wanting news plus basic charts |
| Coinbase | Beginners wanting charting inside their exchange |
TradingView vs Binance Charts
Binance’s built-in charts are functional for basic analysis — a few indicators, support and resistance lines. But the depth of analysis, the alert system, the multi-chart layouts, and the cross-exchange data coverage TradingView provides are simply not available in Binance’s native interface. The full comparison is in my TradingView vs Binance Charts guide.
TradingView vs MetaTrader
MetaTrader 4 and 5 are execution-first platforms built around forex and CFD trading with broker integration. TradingView is superior for charting quality, interface, crypto coverage, and multi-asset analysis. Most traders who need both use TradingView for analysis and MetaTrader for execution. My TradingView vs MetaTrader comparison breaks down the specific scenarios where each platform wins.
Several other comparisons are worth reading depending on your trading style and the exchange or broker you already use: TradingView vs Webull, TradingView vs Finviz, TradingView vs NinjaTrader, TradingView vs Thinkorswim, TradingView vs Investing.com, and TradingView vs Coinbase.
Honest Limitations
Every honest TradingView review has to address the genuine limitations — not to undermine the platform, but because knowing them tells you whether it fits your workflow.
It is an analysis platform, not an execution terminal. You cannot route orders directly to your crypto exchange from TradingView in most cases. Broker integrations exist for some forex and CFD providers, and for futures traders through partners like NinjaTrader, but for most crypto traders the workflow is: analyse on TradingView, execute on your exchange. Some traders find this two-platform workflow cumbersome; others find the separation beneficial because it removes the temptation to impulsively enter trades while doing analysis.
Real-time stock data requires additional subscriptions. For stock traders, some market data feeds require separate subscriptions beyond the platform plan. Crypto data is generally live and free.
Performance can degrade with heavy indicator loads. Running eight or more complex custom Pine Script indicators simultaneously on multiple charts can cause chart lag, particularly on lower-specification hardware or slower connections.
Free plan alert expiry. Alerts on the free plan expire after a period of inactivity. For swing traders setting alerts on weekly chart levels that may not fire for weeks, this can result in missed notifications. Paid plans extend or remove expiry limits.
What I Wish TradingView Would Improve
This is separate from the limitations above — this is my personal wishlist after using the platform extensively.
Native execution for more crypto exchanges. A handful of broker and futures integrations exist, but most crypto traders still juggle two tabs — TradingView for analysis, the exchange for execution. Even a limited, opt-in order-routing option for major exchanges would remove real daily friction.
A more generous free-plan alert allowance. The alert cap on the free plan pushes traders toward an upgrade faster than the rest of the free feature set would suggest is necessary. A modest increase would make the free plan’s limitations feel less arbitrary.
Clearer in-app labelling of which data is delayed vs live. For stock data specifically, it is not always obvious at a glance whether you are looking at a real-time feed or a delayed one, which matters if you are making a timing decision based on the chart.
Common Mistakes Traders Make With TradingView
After reviewing TradingView across hundreds of trader workflows, these are the patterns that prevent traders from getting the value the platform is capable of delivering.
- Overloading charts with indicators immediately. Start with EMA, RSI, and MACD. Nothing else for the first month. Add complexity only once you can read those three fluently across your primary timeframes.
- Not using alerts. Traders who skip alerts either miss opportunities or develop an anxious screen-watching habit. Every key level on your chart should have an alert attached to it.
- Upgrading to the wrong plan tier. Base the decision on which specific free-plan limitation is actually blocking your analysis, not on a general preference for more features.
- Not saving layouts. Name your layouts, save them after configuring, and load them at the start of each session. TradingView saves indicators, drawings, timeframes, and asset selections within a named layout.
Who Should Use TradingView and Who Should Not
TradingView is the right tool for traders whose edge comes from chart analysis — reading price structure, applying indicators to identify high-probability setups, and using alerts to monitor markets without constant screen time. It is especially strong for crypto traders because of its multi-exchange data coverage, 24/7 alert monitoring, and indicator depth for assets traditional financial platforms do not cover well.
| Best For | Not Ideal For |
|---|---|
| Traders who read price charts before every decision | Traders relying entirely on fundamental analysis with no chart reference |
| Crypto traders monitoring multiple exchanges | Anyone wanting a single integrated execution environment with direct broker routing |
| Swing and day traders using multi-timeframe analysis | Investors who check prices once a month with no need for alerts |
| Traders who want to build or use custom Pine Script indicators | Traders wanting an all-in-one broker-and-chart platform |
Pros and Cons
| Pros | Cons |
|---|---|
| Fast, responsive charting on every device | No native execution for most crypto exchanges |
| Free plan is a genuine starting point, not a demo | Real-time stock data can require extra subscriptions |
| Server-side alerts work without the platform open | Heavy multi-indicator setups can cause lag |
| Tens of thousands of free Pine Script indicators | Free plan alerts expire after inactivity |
| Multi-exchange crypto data in one interface | Multi-chart layouts require a paid upgrade |
What To Do Next
If you want to know within 20 minutes whether TradingView fits your workflow, do this: create a free account, open your primary trading asset, and add exactly three indicators — EMA, RSI, and MACD. Set one price alert at a key support or resistance level you already track manually. Use the platform for your next two trading sessions with nothing more than that setup.
If you find yourself wanting a second chart open for a different timeframe, or you hit the active alert limit, that is your signal the paid plan will pay for itself — apply the framework above to confirm it. If the free setup covers what you actually do, stay on it until your analysis needs genuinely outgrow it.
Frequently Asked Questions: TradingView Review
Is TradingView free to use?
Yes — TradingView has a genuinely functional free plan that includes access to all markets, basic charting, three indicators per chart, and a limited number of alerts. It is suitable for beginners and casual traders, and becomes limiting for active traders who need multi-chart layouts, more indicators, or higher alert volumes. No payment details are required to start.
Is TradingView worth paying for in 2026?
For active traders using multi-timeframe analysis, yes. The multi-chart layout is the most impactful upgrade for traders currently switching manually between timeframes. If you are regularly frustrated by the three-indicator limit or single-chart layout, the first paid tier typically resolves both. Verify current pricing and limits at tradingview.com/pricing before upgrading.
Can I use TradingView for crypto trading?
Yes — it is one of the best charting platforms specifically for crypto. It aggregates price data from all major crypto exchanges, covers thousands of pairs, and supports 24/7 alert monitoring for markets that never close. For a complete workflow guide, see my how to use TradingView for crypto trading guide.
How does TradingView compare to MetaTrader?
TradingView is superior for charting quality, interface usability, crypto coverage, and multi-asset analysis. MetaTrader is superior for fully automated trading through broker-native Expert Advisors and direct order routing. Most traders who need both use TradingView for analysis and MetaTrader for execution. My TradingView vs MetaTrader guide covers every relevant difference.
Is TradingView good for beginners?
Yes — the free plan suits beginners well. The interface is more approachable than most professional charting platforms, and the built-in indicator library covers everything a new trader needs to learn chart reading. The main adjustment is resisting the temptation to add every available indicator at once — starting with two or three core indicators produces better learning outcomes.
Is TradingView safe?
Yes — TradingView is a charting and analysis platform, not a custodian of your funds, which significantly limits security risk compared to an exchange or broker. Use a strong unique password and enable two-factor authentication where available. Where TradingView connects to a broker for execution, that connection uses the broker’s own authentication rather than storing your funds or credentials on TradingView’s side. The platform never requires access to your crypto wallets or exchange withdrawal permissions.
TradingView Review: Final Verdict
If I had to summarise TradingView in one sentence: it is the best place to analyse markets before deciding whether a trade deserves your money. It is one of the strongest retail charting platforms available — not despite its limitations, but with a clear understanding of what it is and what it is not. It is an analysis platform. It is not an execution terminal, an automated trading system, or a broker. Used for what it is actually designed to do — chart analysis, multi-timeframe workflow, alerts, and indicator-based decision making — it competes strongly with any alternative at its price point. The honest caveat: if you want everything in one app, including order execution, TradingView alone will not give you that.
Start on the free plan. Use it for at least two weeks with nothing more than EMA, RSI, and MACD on your primary trading asset. If you find yourself limited by the single-chart layout or the three-indicator cap before those two weeks are up, a plan upgrade is immediately justified.
For active traders who rely on chart analysis daily, TradingView’s paid plans are worth the investment. Explore TradingView’s current plan options here.
