
TradingView Heikin Ashi: Honest Complete Guide (2026)
This article contains affiliate links. If you sign up for TradingView through a link on this page, I may earn a commission at no extra cost to you. I only recommend tools I have genuinely evaluated.
Trading involves risk. Technical analysis tools do not guarantee profitable results. Past performance is not indicative of future results. Always manage your risk appropriately.
TradingView Heikin Ashi charts are available on every plan including the free Basic tier and take four clicks to activate. I am Andreas Maratheftis, and after 30 years in professional finance I can tell you that Heikin Ashi is one of the most misunderstood chart types in retail trading — not because it is complicated, but because most traders do not understand what it is actually showing them. This guide covers exactly how to switch to Heikin Ashi on TradingView, how to read the candles correctly, the settings worth changing, and the one critical limitation that most guides completely ignore.
Quick Answer
To switch to Heikin Ashi on TradingView, click the candle icon in the top toolbar and select “Heikin Ashi” from the dropdown. It is available on all plans including Basic. Heikin Ashi smooths price action by averaging OHLC data across two periods, making trends easier to read but hiding the actual price levels. The key limitation most traders miss: Heikin Ashi candles do not show real prices. The values displayed are averaged — not what the market actually traded at. This matters significantly for setting stops, entries, and exits at precise price levels.
Open TradingView free and switch to Heikin Ashi on any chart today — no subscription required.
What Is Heikin Ashi and How Does It Work?
Heikin Ashi means “average bar” in Japanese. Instead of plotting the raw open, high, low, and close prices for each period, it calculates modified values using a two-period averaging formula. The result is a chart that looks similar to a standard candlestick chart but shows smoother, more continuous trends.
The formula TradingView uses:
| Value | Formula |
|---|---|
| HA Close | (Open + High + Low + Close) / 4 |
| HA Open | (Prior HA Open + Prior HA Close) / 2 |
| HA High | Maximum of (High, HA Open, HA Close) |
| HA Low | Minimum of (Low, HA Open, HA Close) |
The practical effect of this formula is that small counter-trend moves get absorbed into the averaging calculation, producing longer runs of same-coloured candles during trends. A strong uptrend shows a series of green candles with no lower wicks. A strong downtrend shows a series of red candles with no upper wicks. Periods of consolidation or indecision produce small-bodied candles with wicks on both sides — the same signal that standard dojis provide, but smoother.
What this gains in clarity, it loses in precision. Because these values are derived from averages, the prices shown on the chart are not the actual traded prices. TradingView addresses this by displaying two price values on the right-hand scale — the actual current price and the Heikin Ashi price — so you always know where the market actually is, even when viewing averaged candles.
How to Switch to Heikin Ashi on TradingView
Switching chart types on TradingView takes four clicks and works on all plans including the free Basic tier.
- Open any chart on TradingView
- Look for the candle icon in the top toolbar — it sits between the timeframe selector and the Indicators button
- Click it — a dropdown appears showing all available chart types
- Select “Heikin Ashi” from the list
The chart updates immediately. You will notice the candles look smoother, with fewer alternating red/green switches and more sustained colour runs during trending periods.
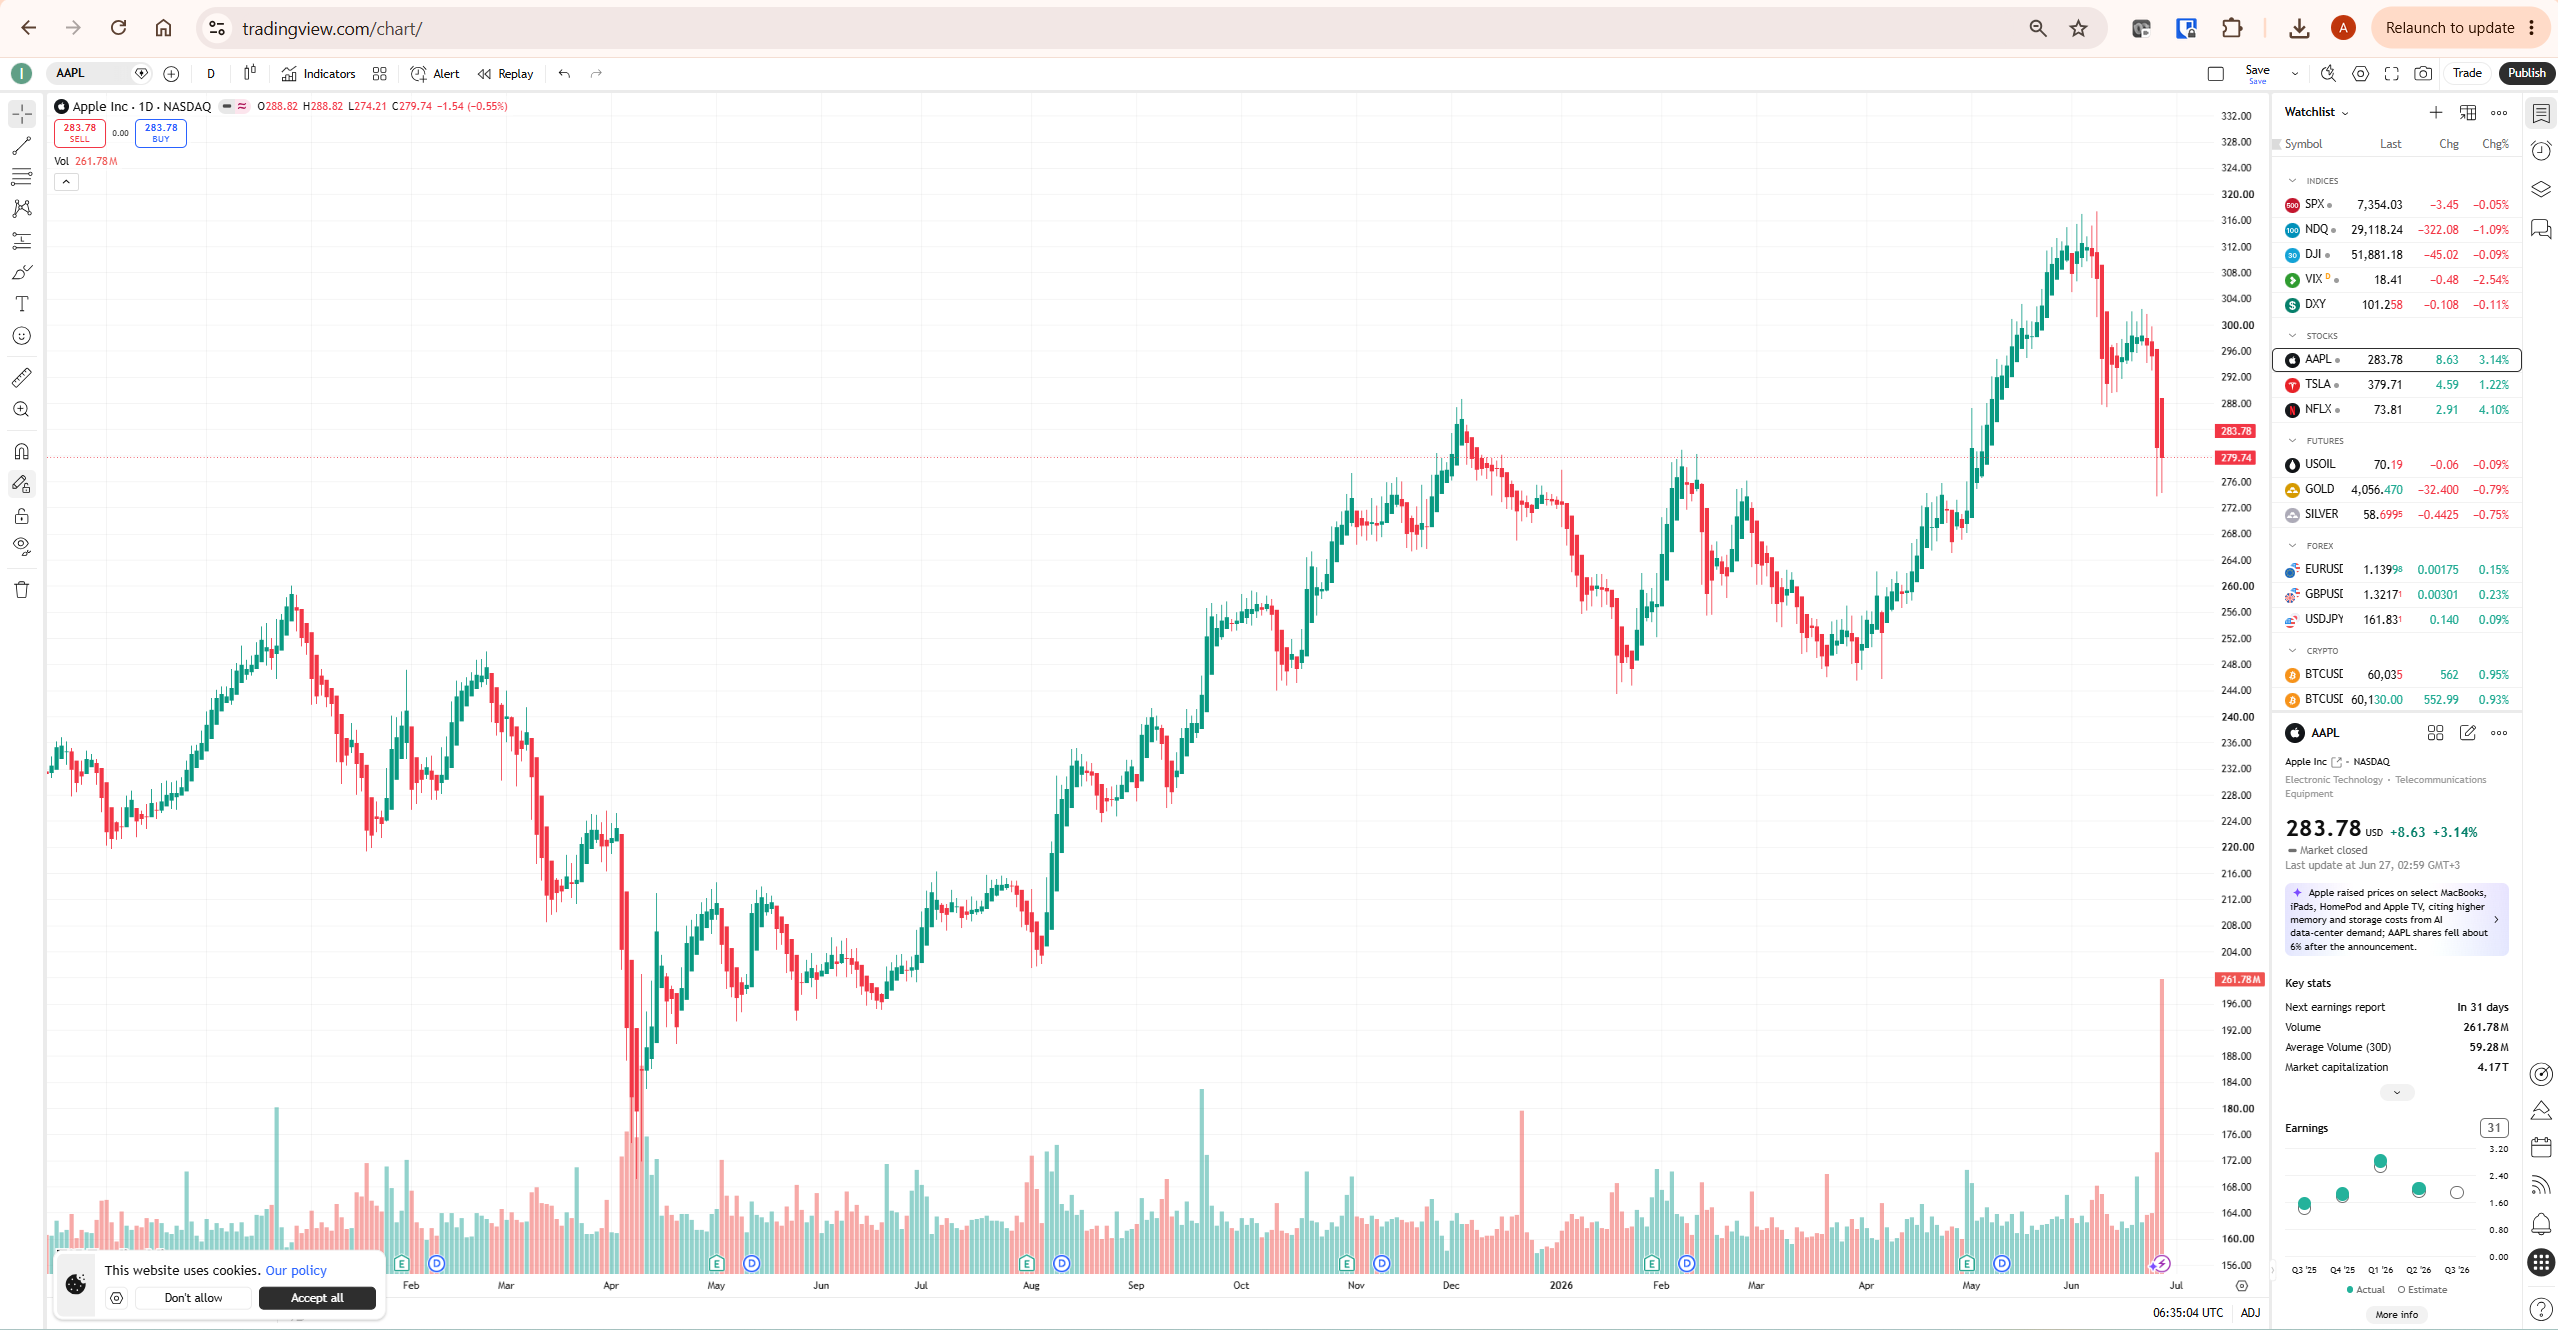
To switch back, click the same candle icon and select “Candles” from the top of the dropdown list.
How to Read the Candles on TradingView
Reading Heikin Ashi is simpler than reading standard candlestick patterns because it removes most of the noise that candlestick pattern recognition requires. The signals reduce to four visual cues.
| What You See | What It Signals | How to Use It |
|---|---|---|
| Consecutive green candles with no lower wicks | Strong uptrend — buying pressure sustained across multiple periods | Stay long or look for continuation entries on pullbacks to the HA open |
| Consecutive red candles with no upper wicks | Strong downtrend — selling pressure sustained across multiple periods | Stay short or avoid long positions until the trend changes |
| Candles with wicks on both sides and small bodies | Consolidation, indecision, or trend exhaustion | Reduce position size, tighten stops, or wait for the next directional signal |
| First candle of opposite colour after a sustained run | Potential trend reversal — not confirmed yet | Use as a trigger to watch for confirmation, not an immediate entry signal |
| Green candles developing lower wicks | Uptrend losing momentum — buyers failing to sustain the full move each period | Warning signal — monitor for trend change |
| Red candles developing upper wicks | Downtrend losing momentum — sellers failing to sustain the full move each period | Warning signal — monitor for potential base formation |
The practical advantage for trend traders is the reduced whipsaw. Standard candlestick charts often show alternating red and green candles during a trending market, triggering premature exits. The averaging formula absorbs those small counter-moves into its averaging and keeps the trend colour consistent for longer, making it easier to stay in a trade through minor pullbacks.
Settings Worth Configuring
TradingView provides several configuration options worth adjusting. Access them by clicking the gear icon in the top toolbar after switching to HA mode, then selecting the Symbol tab.
Real prices on price scale: This is the most important setting. When enabled, TradingView shows the actual market price on the right-hand scale alongside the Heikin Ashi price. Keep this on at all times. Without it, you are reading averaged values as if they were real prices — a significant risk if you are placing stops or entries based on the chart.
Color bars based on previous close: When enabled, candle colour is determined by whether the close is higher or lower than the previous bar’s close, rather than by the HA open vs close relationship. This changes the visual rhythm of the chart. The default (off) is generally more useful for trend reading.
Body and wick styling: Standard visual customisation — candle width, colour scheme, and wick thickness. The defaults work well. The only change worth considering is reducing candle width slightly if you are running Heikin Ashi alongside other indicators on a crowded chart.
Chart timeframe: The smoothing effect works best on higher timeframes — daily, weekly, and 4-hour. On shorter timeframes (5-minute, 15-minute), the smoothing effect reduces and the chart begins to behave more like standard candles with slightly less noise. For short-term traders, the daily Heikin Ashi chart is often used as a trend direction filter rather than the primary entry timeframe.
For a full guide to TradingView’s chart customisation options, see our TradingView Review for the complete platform overview.
Heikin Ashi vs Standard Candles: When to Use Each
The choice between Heikin Ashi and standard candlesticks is not about which is better — it is about which serves your current analytical purpose.
| Use Case | Better Chart Type | Why |
|---|---|---|
| Identifying trend direction and strength | Heikin Ashi | Sustained colour runs make trend health immediately visible |
| Setting precise entry and exit levels | Standard candles | HA prices are averaged — actual support, resistance, and key levels show on real candles |
| Swing trading — staying in trends through pullbacks | Heikin Ashi | Reduces whipsaw exits triggered by minor counter-moves |
| Reading candlestick patterns (engulfing, pin bars, doji) | Standard candles | HA smoothing distorts pattern shapes — patterns on HA are less reliable |
| Monitoring trend momentum and exhaustion | Heikin Ashi | Wick development signals momentum change before the trend reverses |
| Placing stops at precise price levels | Standard candles | HA stop levels are averaged — real support/resistance must be verified on standard chart |
| Chart Type | Price Shown | Noise Level | Best For | Worst For |
|---|---|---|---|---|
| Standard Candles | Actual OHLC prices | High — shows every move | Precise entries, exits, and level identification | Filtering noise during sustained trends |
| Heikin Ashi | Averaged HA prices | Medium — smoothed but retains wicks | Trend direction, swing trading, momentum reading | Backtesting, precise level placement, pattern trading |
| Renko | Fixed brick size — not time-based | Low — removes time and minor moves | Pure trend identification with maximum noise removal | Time-sensitive analysis, volume interpretation |
Many experienced traders run both simultaneously — Heikin Ashi on one chart for trend context and standard candles on another for entry timing and level identification. TradingView’s multi-chart layout feature makes this straightforward. See our TradingView multiple charts guide for the setup process.
Combining With Indicators on TradingView
The chart type works with all of TradingView’s built-in and community indicators. The smoothing effect of HA candles can actually improve the readability of some indicators by reducing the noise in the underlying price data those indicators calculate from.

EMA and moving averages: Running a 20 or 50 EMA on a Heikin Ashi chart gives you a clean trend filter. When price is above the EMA and candles are consistently green with no lower wicks, the trend is confirmed and strong. When HA candles begin to develop lower wicks while still above the EMA, momentum is fading before the EMA itself signals a change.
RSI: Many traders find RSI applied to Heikin Ashi charts easier to interpret because the underlying price series is smoother. Overbought and oversold readings develop more gradually, with less tendency toward brief spikes that trigger false signals. The combination of RSI divergence with an HA colour change provides a useful reversal signal — though not a guaranteed one.
Volume: Standard volume bars remain the same regardless of whether you are viewing HA or standard candles — volume reflects actual traded contracts, not averaged prices. This is useful context: a sustained HA green run accompanied by declining volume is a warning signal even if the candles look clean. Volume tells you how much conviction is behind the smoothed trend.
For traders using TradingView’s alert system, you can set alerts based on indicator conditions while viewing Heikin Ashi charts. The alert fires on the indicator’s value, not on HA candle colour — so RSI alerts, moving average crossover alerts, and price alerts all work normally. See our TradingView Alerts guide for the full setup.
The Critical Limitation: Averaging and Backtesting
This is the limitation most guides skip entirely — and it is important enough to cover in detail.
If you run a Pine Script strategy on a Heikin Ashi chart in TradingView’s Strategy Tester, the backtest will produce unrealistic results. The reason is that the strategy evaluates entry and exit conditions using Heikin Ashi prices — the averaged values — rather than the actual traded prices. Because HA prices are smoother and lag real price movement slightly, strategies that look for HA candle colour changes will appear to enter at prices that were not actually achievable in the market at that moment.
In practice this means backtested results on HA charts tend to be overstated. A strategy that shows 70% win rate on HA data may perform significantly worse on live markets where fills happen at actual prices, not averaged ones.
The correct approach: use standard candlestick charts for all backtesting, even if you plan to use Heikin Ashi for visual trend analysis. If you want to incorporate HA signals into a Pine Script strategy, use the HA formula within the script to calculate HA values but execute entries and exits at real close prices. This gives you the trend-filtering benefit of HA without the backtesting distortion.
TradingView’s official Heikin Ashi documentation acknowledges that HA shows averaged prices rather than actual prices. For an independent perspective on chart type selection and technical analysis methodology, Investopedia’s Heikin Ashi guide covers the method’s history and limitations clearly.
Using This Chart Type for Crypto Trading
The chart type is particularly popular among crypto traders because crypto markets trend strongly for extended periods — exactly the condition where HA’s smoothing advantage is most useful. Bitcoin’s major bull and bear cycles on the weekly chart produce clear, extended HA colour runs that make trend direction obvious even to traders new to the chart type.
Because cryptocurrency trades 24/7, the smoothing effect often produces exceptionally long uninterrupted trend sequences compared with traditional stock markets — a characteristic that makes HA particularly readable on crypto weekly charts. The limitation matters more in crypto too. Crypto prices move fast and gaps can be significant. When BTC reverses sharply on high volume, HA candles lag the actual reversal by one or two periods because the averaging formula needs time to reflect the new direction. Traders relying solely on HA colour changes for exits may hold positions through the early part of a sharp reversal. Standard candle wicks and real-price support levels catch these moves faster.
The practical crypto workflow: weekly or daily HA chart for trend direction, standard candles on a 4H or 1H chart for entry timing. When the daily HA trend is clearly green and the 4H standard candles show a pullback to key support with a reversal candle, that multi-timeframe confluence is a higher-quality setup than either signal alone.
Who Should Use Heikin Ashi — and Who Should Avoid It
The chart type suits some trading styles well and works against others. Knowing which side you are on before adopting it saves significant frustration.
| Trader Type | Heikin Ashi Suitable? | Reason |
|---|---|---|
| Swing traders | Well suited | Trend colour runs align with multi-day holding periods; reduces false exits during pullbacks |
| Trend followers | Well suited | Sustained colour runs make trend health immediately visible across weeks or months |
| Crypto position traders | Well suited | Bitcoin and major altcoin cycles produce clear HA structures on weekly and monthly charts |
| Day traders and scalpers | Less suitable | On short timeframes the smoothing effect is minimal; averaged prices create entry/exit confusion |
| Candlestick pattern traders | Less suitable | HA smoothing distorts classic patterns — engulfing candles, pin bars, and dojis are unreliable on HA charts |
| Support and resistance traders | Less suitable | HA prices are averaged — key levels must be verified on real-price charts before use |
| Algorithmic / backtesting traders | Avoid for backtesting | HA backtests overstate performance — always backtest on standard candles |
Common Heikin Ashi Mistakes on TradingView
The most common mistake is placing stops and entries based on Heikin Ashi price levels. If a HA candle closes at 280 but the actual price is 278, setting a stop at the HA low will place it at the wrong level. Always verify entry, stop, and target levels on the real-price chart or use the “Real prices on price scale” setting to keep actual levels visible.
The second mistake is treating the first opposite-coloured candle as an immediate reversal signal. Because HA smooths price action, a single red candle after a green run often reflects a brief consolidation rather than a genuine trend change. Wait for two or three consecutive candles of the opposite colour with appropriate wick structure before treating the trend as reversed.
The third mistake is running backtests on HA charts and trusting the results. As covered in the limitation section, HA backtests overstate strategy performance because entries and exits are evaluated at averaged prices. Always backtest on standard candles.
The fourth mistake is using HA on timeframes that are too short. On 1-minute or 5-minute charts, the smoothing effect is minimal and the averaged prices create more confusion than clarity. The smoothing advantages emerge most clearly from the 1-hour timeframe upward.
What To Do Next
Open TradingView on any instrument you follow regularly and switch to Heikin Ashi on the daily chart. Identify the current trend colour run — how many consecutive same-coloured candles are there, and are the wicks developing in a way that suggests momentum is building or fading? Then switch back to standard candles on the same timeframe and compare what you see. That side-by-side observation will immediately show you what Heikin Ashi adds and what it hides. Do this for one week before incorporating HA into any trading decisions.
Related TradingView Guides
- TradingView Review 2026 — complete platform overview including all chart types and plan features
- TradingView Free vs Paid — full plan comparison including which features require a subscription
- TradingView Multiple Charts — how to run Heikin Ashi and standard candles side by side
- TradingView Alerts Explained — how to set alerts on indicators while viewing Heikin Ashi charts
- TradingView Strategy Tester — why you should always backtest on standard candles, not Heikin Ashi
Frequently Asked Questions
What is Heikin Ashi on TradingView?
This is a chart type available on TradingView that smooths price action by averaging OHLC data across two periods. Unlike standard candlesticks which show raw open, high, low, and close prices, Heikin Ashi calculates modified values that reduce noise and make trends easier to identify. It is particularly useful for trend traders who want to stay in positions through minor pullbacks without getting shaken out by normal market noise.
How do I switch to Heikin Ashi on TradingView?
Click the candle icon in the top toolbar of any TradingView chart, then select “Heikin Ashi” from the dropdown. The chart updates immediately. To switch back, click the same icon and select “Candles.” Heikin Ashi is available on all TradingView plans including the free Basic tier — no subscription is required.
Is Heikin Ashi free on TradingView?
Yes. Heikin Ashi is available on all TradingView plans including the free Basic plan. All chart types — including Heikin Ashi, Renko, Line Break, Kagi, and Point and Figure — are accessible without a paid subscription. Some advanced chart types like Renko require a paid plan for certain configurations, but the standard Heikin Ashi chart type has no plan restrictions.
Is Heikin Ashi better than candlesticks?
Neither is universally better — they serve different purposes. HA is better for identifying trend direction and staying in trades through minor counter-moves. Standard candles are better for precise entry and exit levels, candlestick pattern recognition, and backtesting. Most experienced traders use both: Heikin Ashi for trend context on higher timeframes and standard candles for entry timing and level identification on shorter timeframes.
Can I use Heikin Ashi for backtesting on TradingView?
Technically yes, but the results will be unreliable. Backtesting on Heikin Ashi charts produces overstated results because the Strategy Tester evaluates entries and exits at averaged HA prices rather than actual traded prices. This makes strategies appear more profitable than they would be in live trading. Always run backtests on standard candlestick charts. If you want HA-based signals in a strategy, calculate HA values within Pine Script and execute at real close prices.
What do these candles tell you?
These candles indicate trend direction, trend strength, and potential reversals. Consecutive green candles with no lower wicks signal a strong uptrend. Consecutive red candles with no upper wicks signal a strong downtrend. Candles with wicks on both sides and small bodies indicate consolidation or indecision. The first opposite-coloured candle after a sustained run suggests a potential trend change — but wait for confirmation before acting on it.
Does Heikin Ashi repaint on TradingView?
No — Heikin Ashi does not repaint in the way that repainting indicators do. Each candle is calculated from the final OHLC values of the completed bar using the HA formula, and those values do not change once the bar closes. The live (forming) candle will update as new price data comes in during the period, which is normal behaviour for any chart type. Once the bar closes, the HA values are fixed. This is different from repainting indicators that recalculate historical bars based on future data.
Why does TradingView show two prices on this chart type?
TradingView displays both the actual current market price and the Heikin Ashi price on the right-hand scale because HA values are averaged and do not reflect real traded prices. The actual price is shown so you always know where the market is trading, even when viewing the smoothed HA representation. This is an important safety feature — always use the actual price for stops, entries, and targets, not the HA price.
Trading disclaimer: Trading involves risk. Technical analysis tools do not guarantee profitable results. Past performance is not indicative of future results. Always manage your risk appropriately.
