
TradingView Bollinger Bands: Honest Settings Guide (2026)
Affiliate Disclosure: This article contains affiliate links. If you sign up for TradingView through a link on this page, I may earn a commission at no extra cost to you. I only recommend tools I have researched and believe are relevant to the reader’s use case.
Trading involves risk. This article is for educational purposes only and is not financial advice. Technical analysis tools do not guarantee profitable results. Past performance is not indicative of future results. Always manage your risk appropriately.
Last verified: August 2026, using TradingView’s official documentation and indicator library.
TradingView Bollinger Bands is one of the most recognisable volatility indicators available on the platform, and it is built in and free on every plan including Basic. I am Andreas Maratheftis, and after 30 years in professional finance I can tell you that Bollinger Bands are simple to read but genuinely difficult to use well, because the correct interpretation flips depending on whether the market is ranging or trending. Traders who apply the same reading in both conditions get badly burned. This guide covers exactly how to add Bollinger Bands on TradingView, the formula behind them, the squeeze setup, how to tell which market regime you are in, and the honest limitation that catches most traders who fade the bands in a strong trend.
Key Takeaways
- Bollinger Bands are a free, built-in TradingView indicator: a 20-period SMA with upper/lower bands set 2 standard deviations away by default
- The bands widen in high volatility and contract in low volatility — they measure volatility, not direction
- Interpretation depends entirely on market regime: fade band touches in a ranging market, but treat them as continuation signals in a trending market
- A “squeeze” (narrow bands) often precedes a volatility expansion, but does not indicate breakout direction
- The most costly mistake is fading every band touch regardless of whether the market is trending or ranging
Quick Answer
Bollinger Bands are a built-in, free TradingView indicator consisting of a middle simple moving average (default 20-period) flanked by an upper and lower band set a chosen number of standard deviations away (default 2). The bands widen automatically during high volatility and contract during low volatility. In a ranging market, price bouncing off the bands can signal mean-reversion opportunities. In a trending market, price can “walk the band” — hugging the upper or lower band for an extended period — which means fading a band touch during a strong trend is one of the most common and costly Bollinger Bands mistakes. Recognising which regime applies is the actual skill, not the indicator itself.
Open TradingView free and add Bollinger Bands to any chart today.
What Are Bollinger Bands?
Bollinger Bands are a volatility-based indicator consisting of three lines plotted directly on the price chart: a middle moving average and two outer bands set a defined number of standard deviations above and below it. Unlike a fixed-width channel, the bands expand and contract dynamically based on how volatile the market currently is — widening during periods of high volatility and narrowing when the market calms down.
This self-adjusting behaviour is what distinguishes Bollinger Bands from a simple fixed channel. They do not impose a rigid frame on the market; they respond to what the market is actually doing. A stock trading calmly within a narrow range produces tight bands. The same stock moving sharply on an earnings surprise produces bands that expand rapidly to reflect the new volatility. For further background on the indicator’s development and standard interpretation, Investopedia’s Bollinger Bands guide covers the fundamentals clearly.
The Bollinger Bands Formula Explained
| Component | Formula | What It Does |
|---|---|---|
| Middle Band | Simple Moving Average (default 20-period) | The central trend reference line the bands are built around |
| Upper Band | Middle Band + (Multiplier × Standard Deviation) | The upper volatility boundary — default multiplier is 2 |
| Lower Band | Middle Band − (Multiplier × Standard Deviation) | The lower volatility boundary — default multiplier is 2 |
| Standard Deviation | Statistical measure of price dispersion over the lookback period | Expands during volatile periods, contracts during calm periods — this is what makes the bands adaptive |
Under a normal statistical distribution, ±2 standard deviations contain roughly 95% of observations. Financial markets often deviate from that assumption, so price can remain outside the bands more frequently than the statistic alone would suggest. Price closing outside the bands is still generally read as a signal of an unusually strong move — though, as covered later, this does not automatically mean the move is finished.
How to Add Bollinger Bands on TradingView
Bollinger Bands are a built-in TradingView indicator and take three clicks to add — no subscription required.
- Open any chart on TradingView
- Click the Indicators button in the top toolbar
- Type “Bollinger Bands” in the search box and select the built-in version listed under the Technicals section (not a community script)
The three lines appear immediately on the chart with default settings — 20-period SMA and 2 standard deviations.
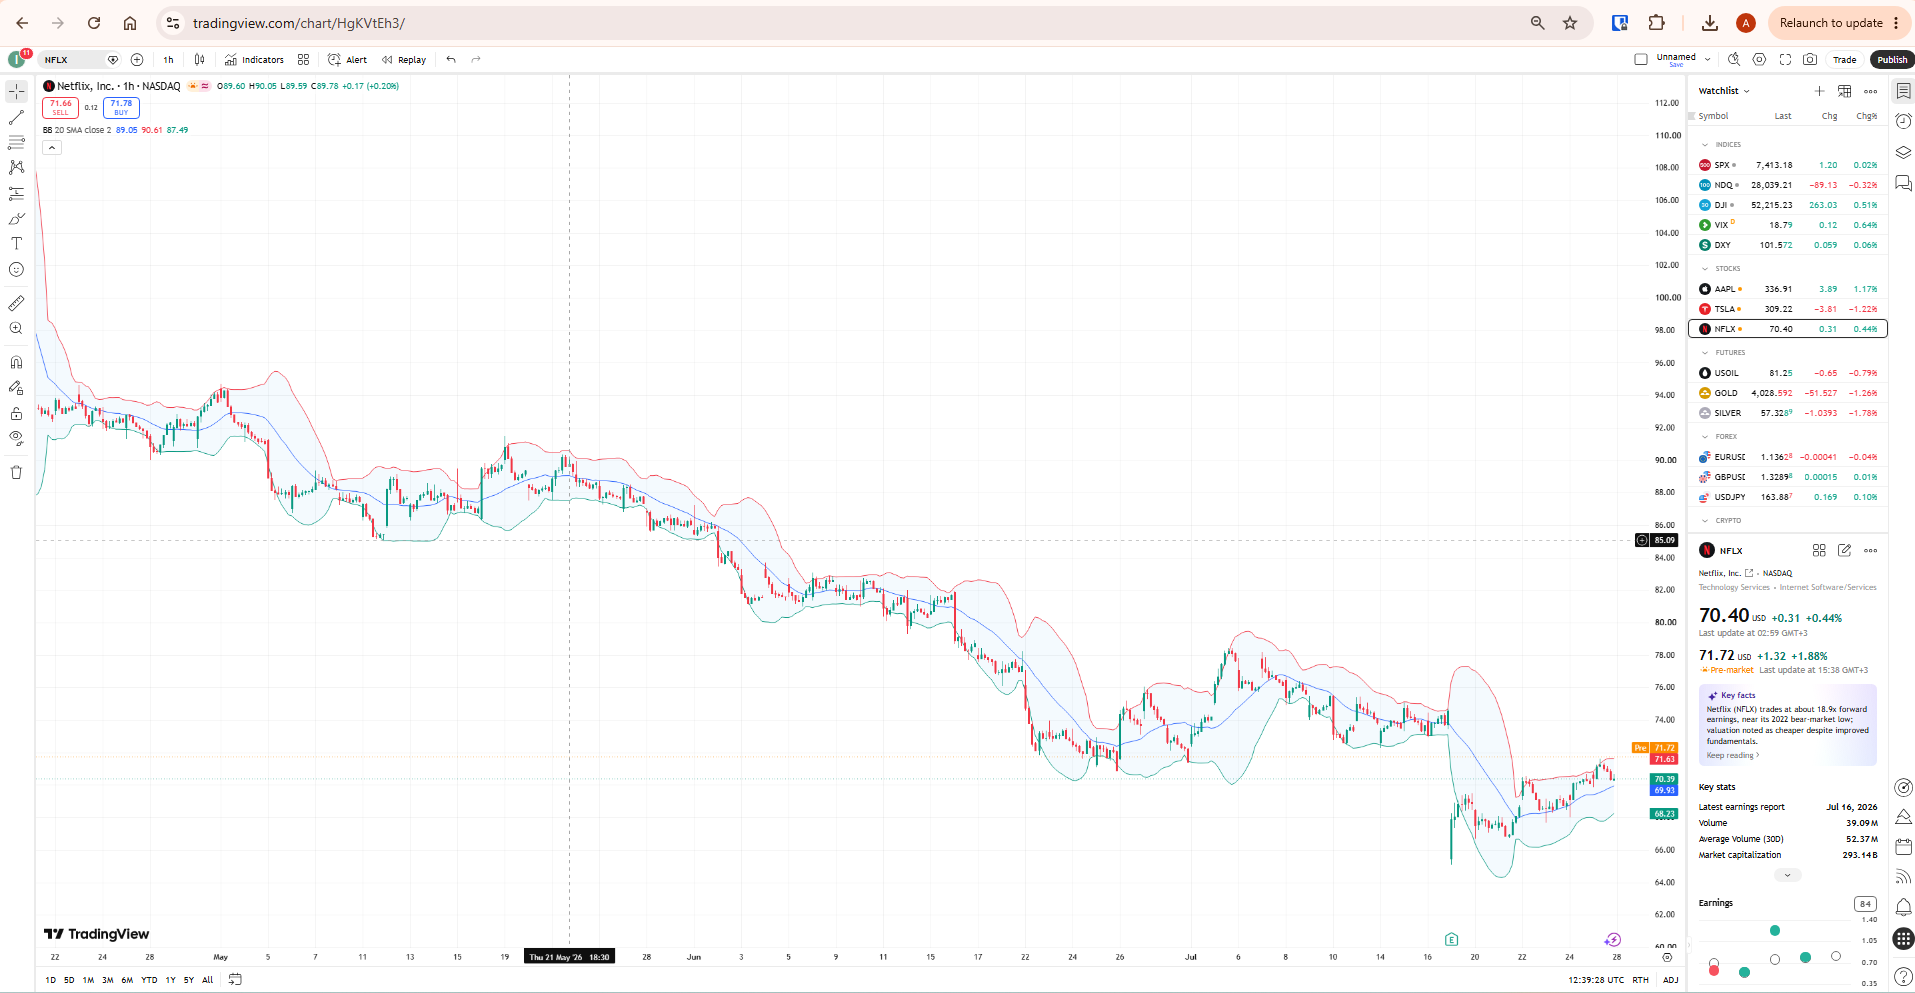
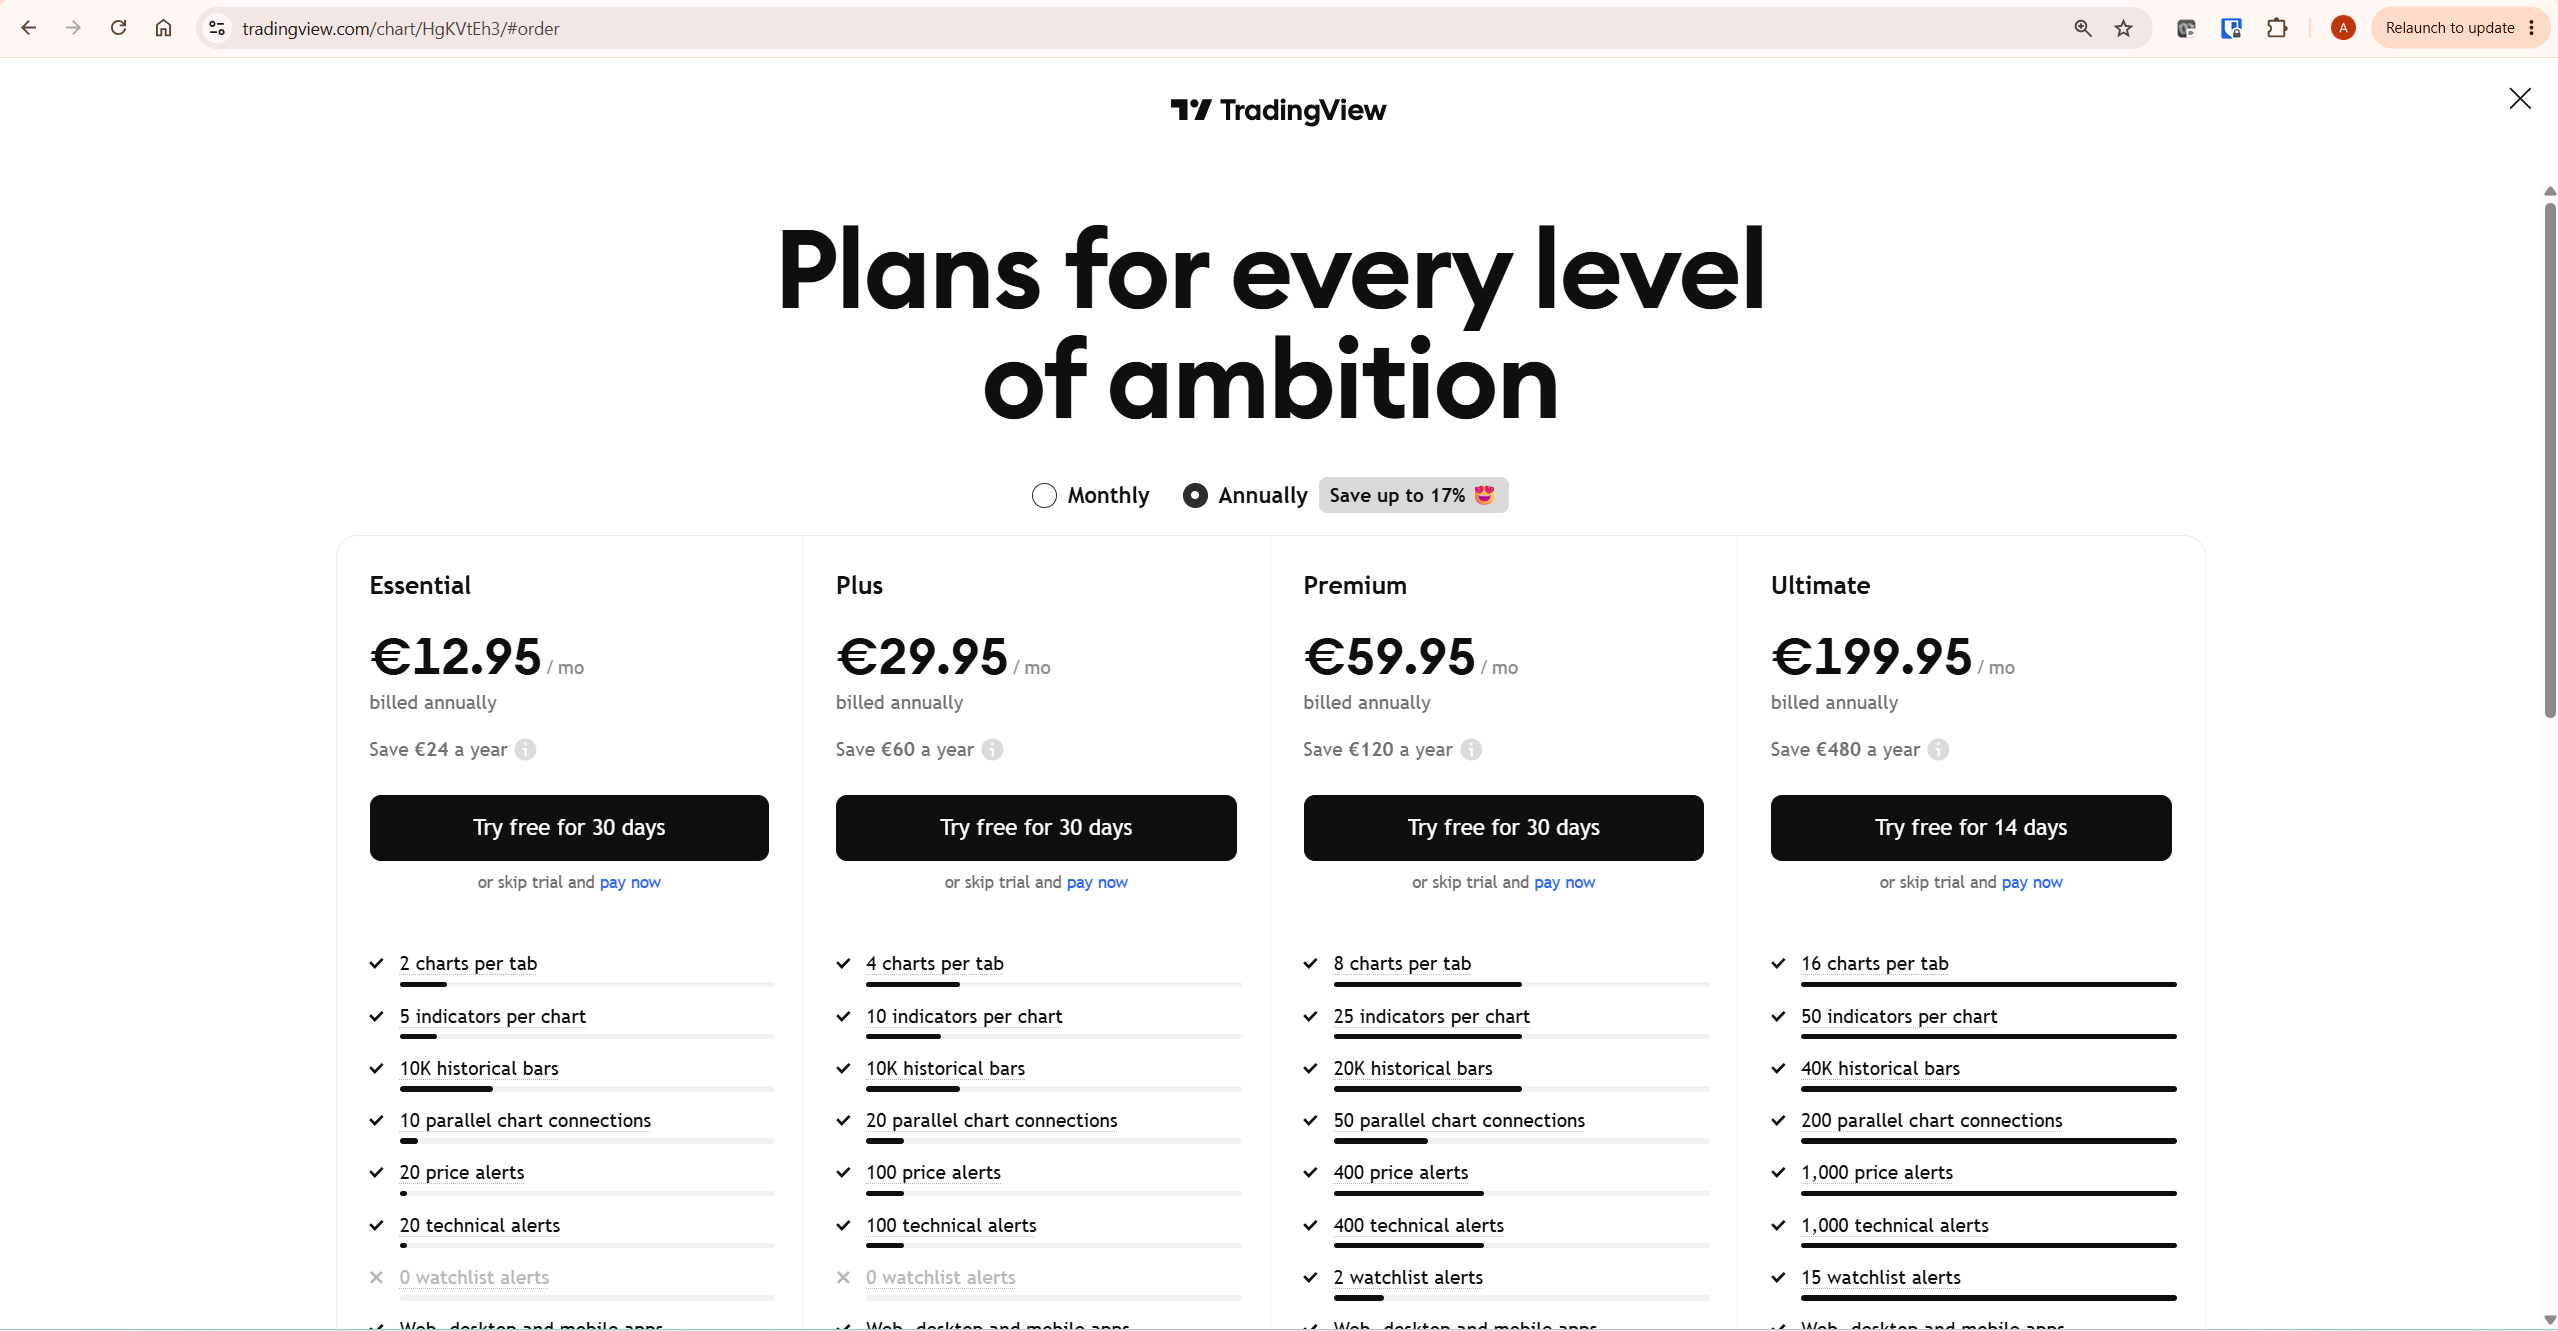
Note that on the free Basic plan, TradingView limits the total number of indicators applied per chart simultaneously. If Bollinger Bands does not appear because you have reached your limit, remove another indicator first — verify current plan limits at tradingview.com/pricing.
Bollinger Bands Settings on TradingView
Right-click the Bollinger Bands indicator and select Settings to adjust the two core inputs.
| Setting | Default | Effect of Lowering It | Effect of Raising It |
|---|---|---|---|
| Length (SMA Period) | 20 | Bands react faster to recent price changes — more sensitive, more frequent touches | Bands smooth out further — slower to react, fewer but more significant touches |
| Standard Deviation (Multiplier) | 2 | Bands sit closer to price — more touches, more false signals in choppy markets | Bands sit further from price — fewer touches, but each one is statistically more significant |
The default 20/2 combination is a reasonable starting point across most timeframes and asset classes. Some traders experiment with shorter lengths (around 10 periods) and a tighter multiplier (1.5–1.8) for scalping on very short timeframes, where faster reaction to price changes is prioritised over signal reliability — this trade-off should be tested thoroughly before relying on it, since shorter settings also produce more false touches.
Reading Bollinger Bands: Ranging vs Trending Markets
This is the single most important concept for using Bollinger Bands correctly. The same visual signal — price touching a band — means something completely different depending on the market regime.
| Market Regime | How Bands Behave | What a Band Touch Means | How to Trade It |
|---|---|---|---|
| Ranging / Sideways | Bands stay relatively flat and price oscillates between them | Price at the upper band suggests overextension; price at the lower band suggests undersold conditions | Mean-reversion setups — fade the touch, targeting a return toward the middle band |
| Trending | Bands slope in the trend direction and price “walks” along one band | Price at the band reflects sustained directional strength, not exhaustion | Trend-continuation setups — the band acts as dynamic support/resistance in the trend direction, not a fade signal |
The critical skill is recognising which regime currently applies before deciding how to interpret a band touch. Checking the higher timeframe trend first — is the daily 50-period moving average sloping up or down, and is price above or below it — gives useful context before reacting to a band touch on a lower timeframe.
The Bollinger Bands Squeeze
One of the most widely used Bollinger Bands setups is the squeeze — a period where the bands narrow significantly, signalling that volatility has contracted to an unusually low level. Historically, extended periods of low volatility tend to precede periods of high volatility, which is why a tight squeeze is often watched closely for an upcoming breakout.
The squeeze itself does not indicate which direction the breakout will go — only that a significant move is more likely soon. Combining the squeeze with a directional bias from a higher timeframe, or waiting for a confirmed close beyond one of the bands, is generally more reliable than guessing direction before the breakout occurs.
To identify a squeeze more objectively rather than relying on a visual eyeball, some traders add the Bollinger Band Width (BBW) indicator alongside the standard bands — this plots the distance between the bands as its own value, making it easier to spot when the current width is near a multi-week or multi-month low.
Combining Bollinger Bands with Other TradingView Tools
Bollinger Bands are most reliable when confirmed by a second, independent signal rather than used alone.
Bollinger Bands and RSI: A price touch at the upper band accompanied by RSI showing overbought conditions strengthens a potential mean-reversion signal in a ranging market. In a trending market, however, RSI can stay overbought for extended periods while price continues walking the upper band — a reminder that RSI confirmation alone does not override the need to identify the correct regime first. See our TradingView RSI Divergence guide for reading momentum shifts alongside band touches.
Bollinger Bands and MACD: A squeeze breakout accompanied by a matching MACD crossover in the same direction adds a momentum-based confirmation layer to a volatility-based signal — the two tools measure different things, so agreement between them carries more weight than either alone. See our TradingView MACD guide for the full setup.
Bollinger Bands and Volume: A breakout from a squeeze accompanied by a clear increase in volume carries more conviction than the same breakout on thin volume, which is more likely to fail and reverse quickly.
Bollinger Bands and trend tools: Combining Bollinger Bands with a trend-following indicator such as Supertrend helps clarify which regime currently applies — if Supertrend confirms an active trend, band touches should generally be read as continuation signals rather than reversal signals. See our TradingView Supertrend guide for the full setup.
Setting Bollinger Bands Alerts on TradingView
Rather than watching charts continuously for a band touch or squeeze, TradingView’s alert system can notify you automatically.
- Add Bollinger Bands to your chart
- Right-click the indicator name and select Add Alert
- Choose the condition — crossing the upper band, crossing the lower band, or crossing back through the middle band
- Set your notification method — push, email, or webhook depending on your plan
- Use Once Per Bar Close frequency to avoid multiple alerts firing on the same touch during intrabar volatility
For the complete alert setup process, see our TradingView Alerts Explained guide. Alert capacity and webhook availability depend on your plan — verify current limits at tradingview.com/pricing.
Bollinger Bands for Crypto Trading on TradingView
Bollinger Bands are widely used in crypto trading, in part because crypto markets alternate between long stretches of low-volatility consolidation and sudden, sharp volatility expansions — exactly the pattern the squeeze setup is designed to identify. A tight squeeze on a Bitcoin daily chart followed by a confirmed breakout has historically preceded some of crypto’s larger directional moves.
The regime-recognition challenge is amplified in crypto because extended trending phases are common — price can walk the upper or lower band for weeks during a strong bull or bear cycle. Traders who mechanically fade every band touch on a trending crypto chart tend to accumulate losses steadily against the prevailing trend. Combining Bollinger Bands with a clear trend filter is particularly important in crypto markets given how long trending phases can persist.

Common Bollinger Bands Mistakes on TradingView
The most common and costly mistake is fading every band touch regardless of market regime. A price touching the upper band during a strong uptrend is not automatically overbought and due to reverse — it may simply be walking the band as the trend continues. Traders who short every upper-band touch during a trending market accumulate losses steadily against the dominant direction.
The second mistake is treating a squeeze as a directional signal. The squeeze indicates that a volatility expansion is more likely soon — it says nothing about which direction the breakout will go. Entering a position based purely on the squeeze without waiting for confirmation of direction is a common and avoidable error.
The third mistake is using the same settings across every asset and timeframe without adjustment. A 20/2 setting that works well on a daily equity chart may generate excessive false touches on a highly volatile intraday crypto chart. Testing settings against the specific instrument’s typical volatility profile before relying on them live improves reliability significantly.
The fourth mistake is reacting to an intrabar wick touching a band rather than waiting for the bar to close. A wick that briefly pierces a band and then closes back inside it often reflects short-term noise rather than a genuine signal. Waiting for a confirmed close beyond the band, particularly for breakout setups, filters out a meaningful portion of false signals.
Honest Limitation: When Bollinger Bands Mislead
Bollinger Bands are a volatility measurement tool, not a directional prediction tool, and this distinction is frequently lost in how the indicator is popularly taught. A band touch tells you that price has moved a statistically significant distance from its recent average — it does not tell you whether that move is a temporary overextension due to revert, or the early stage of a sustained trend that will continue walking the band for an extended period.
This ambiguity is structural, not a flaw in a specific implementation. No adjustment to the Length or Standard Deviation settings resolves it, because the bands are mathematically incapable of distinguishing between these two scenarios on their own. Determining which scenario applies requires additional context — trend direction on a higher timeframe, volume confirmation, or a separate trend-following indicator — that Bollinger Bands alone cannot provide.
A further limitation is that the squeeze setup, while historically associated with subsequent volatility expansion, provides no reliable timing guarantee. A tight squeeze can persist for an extended period before any breakout occurs, and traders who position too early based purely on band width often experience further consolidation rather than an immediate move.
The responsible framing: use Bollinger Bands to measure volatility and identify potential turning points or breakout zones, but always pair the signal with a method for determining the prevailing market regime before deciding whether a band touch is a reversal opportunity or a trend-continuation signal. For a broader look at combining volatility indicators with confirmation tools, BabyPips covers the practical mechanics of trading band touches responsibly.
What To Do Next
Before turning a Bollinger Bands idea into a live strategy, review it on historical charts and, where possible, test the rules systematically. Our TradingView Strategy Tester guide explains how to evaluate rule-based setups before risking real capital.
Open TradingView, add Bollinger Bands with default settings to an instrument you follow regularly, and scroll back through at least three months of price history. Identify periods where the market was clearly ranging versus clearly trending, and note how price behaved at the bands differently in each condition. This exercise will show you directly why the same signal requires different interpretation depending on context — before you risk any capital acting on a band touch.
Create a free TradingView account to add Bollinger Bands to your charts at no cost.
Related TradingView Guides
- TradingView MACD — combining momentum confirmation with Bollinger Bands volatility signals
- TradingView Supertrend — combining trend-following signals with Bollinger Bands regime recognition
- TradingView RSI Divergence — confirming band touches with momentum analysis
- TradingView VWAP — an additional intraday reference for gauging session bias
- TradingView Alerts Explained — automating notifications for band touches and squeezes
- TradingView Strategy Tester — backtesting Bollinger Bands-based strategies before live use
Frequently Asked Questions
What are Bollinger Bands on TradingView?
Bollinger Bands are a built-in, free TradingView indicator consisting of a middle simple moving average and two outer bands set a chosen number of standard deviations away, by default 20-period and 2 standard deviations. The bands widen during high volatility and contract during low volatility, giving traders a visual read on both price position relative to its recent average and the current volatility regime.
How do I add Bollinger Bands on TradingView?
Click the Indicators button in the top toolbar of any TradingView chart, type “Bollinger Bands” in the search box, and select the built-in version listed under the Technicals section. The three lines add immediately with default settings of 20-period SMA and 2 standard deviations. Free Basic plan accounts have a limit on the number of indicators applied per chart simultaneously — remove another indicator first if you have reached your limit.
What is the Bollinger Bands squeeze?
The squeeze refers to a period where the bands narrow significantly, indicating volatility has contracted to an unusually low level. This is often watched as a precursor to a potential breakout, since periods of low volatility have historically tended to be followed by periods of higher volatility. The squeeze itself does not indicate which direction the breakout will go — traders typically wait for a confirmed price close beyond one of the bands, or combine the squeeze with a directional bias from a higher timeframe, before acting.
Are Bollinger Bands good for trending markets?
Bollinger Bands function differently in trending versus ranging markets, and this is the most important concept for using them correctly. In a trending market, price often “walks” along one of the bands for an extended period, meaning a band touch reflects sustained directional strength rather than exhaustion. Traders who fade every band touch assuming mean reversion, without first checking whether the market is trending, are prone to significant losses against the prevailing trend.
What are the best Bollinger Bands settings?
The TradingView default of a 20-period SMA with 2 standard deviations is a reasonable starting point for most instruments and timeframes. Some traders use shorter lengths (around 10 periods) with a tighter multiplier (1.5–1.8) for scalping on very short timeframes, prioritising faster reaction over signal reliability. There is no universally correct setting — always test on historical data for your specific instrument and timeframe before applying live, since shorter, tighter settings also produce more frequent false signals.
Is Bollinger Bands free on TradingView?
Yes. Bollinger Bands is a built-in TradingView indicator available at no cost on the free Basic plan. At the time of writing it does not require a paid subscription. Note that Basic plan accounts have a limit on the total number of indicators that can be applied per chart simultaneously — always verify current plan limits at tradingview.com/pricing.
Bollinger Bands vs Keltner Channels — what is the difference?
Both are volatility-based envelope indicators, but they use different measures. Bollinger Bands use standard deviation of price, which reacts strongly to sudden large price moves. Keltner Channels use Average True Range (ATR), which tends to produce smoother, less erratic band movement. Some traders combine both on the same chart — when Bollinger Bands narrow inside the Keltner Channel, it is sometimes read as an especially strong squeeze signal, since two independent volatility measures are both confirming compressed conditions.
Trading disclaimer: Trading involves risk. This article is for educational purposes only and is not financial advice. Technical analysis tools do not guarantee profitable results. Past performance is not indicative of future results. Always manage your risk appropriately.
