
TradingView RSI Divergence: Honest Complete Guide (2026)
Affiliate Disclosure: This article contains affiliate links. If you sign up for TradingView through a link on this page, I may earn a commission at no extra cost to you. I only recommend tools I have researched and believe are relevant to the reader’s use case.
Trading involves risk. This article is for educational purposes only and is not financial advice. Technical analysis tools do not guarantee profitable results. Past performance is not indicative of future results. Always manage your risk appropriately.
Last verified: August 2026, using TradingView’s official documentation and indicator library.
TradingView RSI divergence is one of the most searched concepts among traders using the platform — and one of the most misapplied. I am Andreas Maratheftis, and after 30 years in professional finance I can tell you that RSI divergence is genuinely useful when applied correctly, but it generates enough false signals to destroy accounts when traders treat it as a standalone entry trigger. This guide covers exactly what RSI divergence is, how to spot it on TradingView, how to use the built-in divergence indicator, the four types you need to know, and the honest limitation that separates traders who profit from it from those who do not.
Key Takeaways
- RSI divergence occurs when price and the RSI indicator move in opposite directions — a warning signal, not a guaranteed reversal
- There are four types: regular bullish, regular bearish, hidden bullish, hidden bearish — regular signals reversals, hidden signals continuation
- TradingView’s built-in RSI Divergence indicator is free on all plans and draws confirmed pivots automatically
- Higher timeframes and structural confluence (support/resistance, volume nodes) make divergence signals more reliable
- Divergence can persist for extended periods in strong trends without producing a reversal — always wait for price confirmation
Quick Answer
RSI divergence occurs when the price of an asset and the RSI indicator move in opposite directions. In a bullish divergence, price makes a lower low while RSI makes a higher low — signalling that downside momentum is weakening before price reverses upward. In a bearish divergence, price makes a higher high while RSI makes a lower high — signalling that upside momentum is fading before price reverses downward. TradingView includes an RSI Divergence indicator developed by TradingView, available from the Indicators menu under the Technicals section. Divergence is a warning signal, not a guaranteed reversal — always wait for confirmation before acting on it.
Open TradingView free and start spotting RSI divergence on any chart today.
What Is RSI Divergence?
The RSI (Relative Strength Index) measures the speed and magnitude of price changes on a scale of 0 to 100. Its default setting is 14 periods, with readings above 70 considered overbought and below 30 considered oversold. Under normal conditions, RSI broadly follows price — when price makes a new high, RSI also makes a new high; when price falls, RSI falls with it.
Divergence occurs when this relationship breaks down. When price and RSI stop moving in the same direction, it signals a change in the underlying momentum driving the price move. The price is still moving in one direction, but the energy behind it — as measured by RSI — is weakening. This divergence between price and momentum is what traders use to anticipate potential reversals before they occur in price itself.
The conceptual foundation is straightforward: momentum typically changes before price does. A price making new highs on declining RSI is showing you that fewer traders are chasing the move with the same conviction — a structural warning that the trend may be approaching exhaustion, even if it has not yet reversed.
The Four Types of RSI Divergence on TradingView
There are four divergence types. The first two — regular divergence — signal potential reversals. The second two — hidden divergence — signal potential trend continuation. Understanding the difference determines whether you are trading against the trend or with it.
| Type | Price Action | RSI Action | Signal | Trading Implication |
|---|---|---|---|---|
| Regular Bullish | Lower low | Higher low | Downward momentum weakening — potential reversal upward | Counter-trend long setup at support with confirmation |
| Regular Bearish | Higher high | Lower high | Upward momentum fading — potential reversal downward | Counter-trend short setup at resistance with confirmation |
| Hidden Bullish | Higher low | Lower low | Uptrend still intact — pullback ending, trend likely to continue | Trend-continuation long during a pullback in an uptrend |
| Hidden Bearish | Lower high | Higher high | Downtrend still intact — bounce ending, trend likely to continue | Trend-continuation short during a bounce in a downtrend |
Regular divergence is what most traders learn first. Hidden divergence is equally important but less widely understood — it tells you that the current pullback or bounce is likely ending and the original trend is about to resume. Many traders who use hidden divergence report it as their highest-probability setup precisely because it aligns with the existing trend rather than fighting it.
How to Spot RSI Divergence on TradingView
Spotting divergence manually requires comparing price swing points with RSI swing points. Here is the step-by-step process on TradingView.
- Add the RSI indicator — click Indicators in the top toolbar, search “RSI,” and add the standard Relative Strength Index from the Technicals section
- Set the timeframe — daily or weekly charts produce the most reliable divergence signals; shorter timeframes generate more noise and more false divergences
- Identify price swing points — look for clear local highs (for bearish divergence) or local lows (for bullish divergence) in the price chart
- Compare with RSI swing points — at those same swing points, check whether RSI is making a corresponding higher high / lower low (confirming trend momentum) or a lower high / higher low (diverging from price)
- Confirm the divergence — the divergence is only valid after both the second price swing and second RSI swing have fully formed. An unconfirmed swing (still forming on the live candle) is not a valid divergence signal
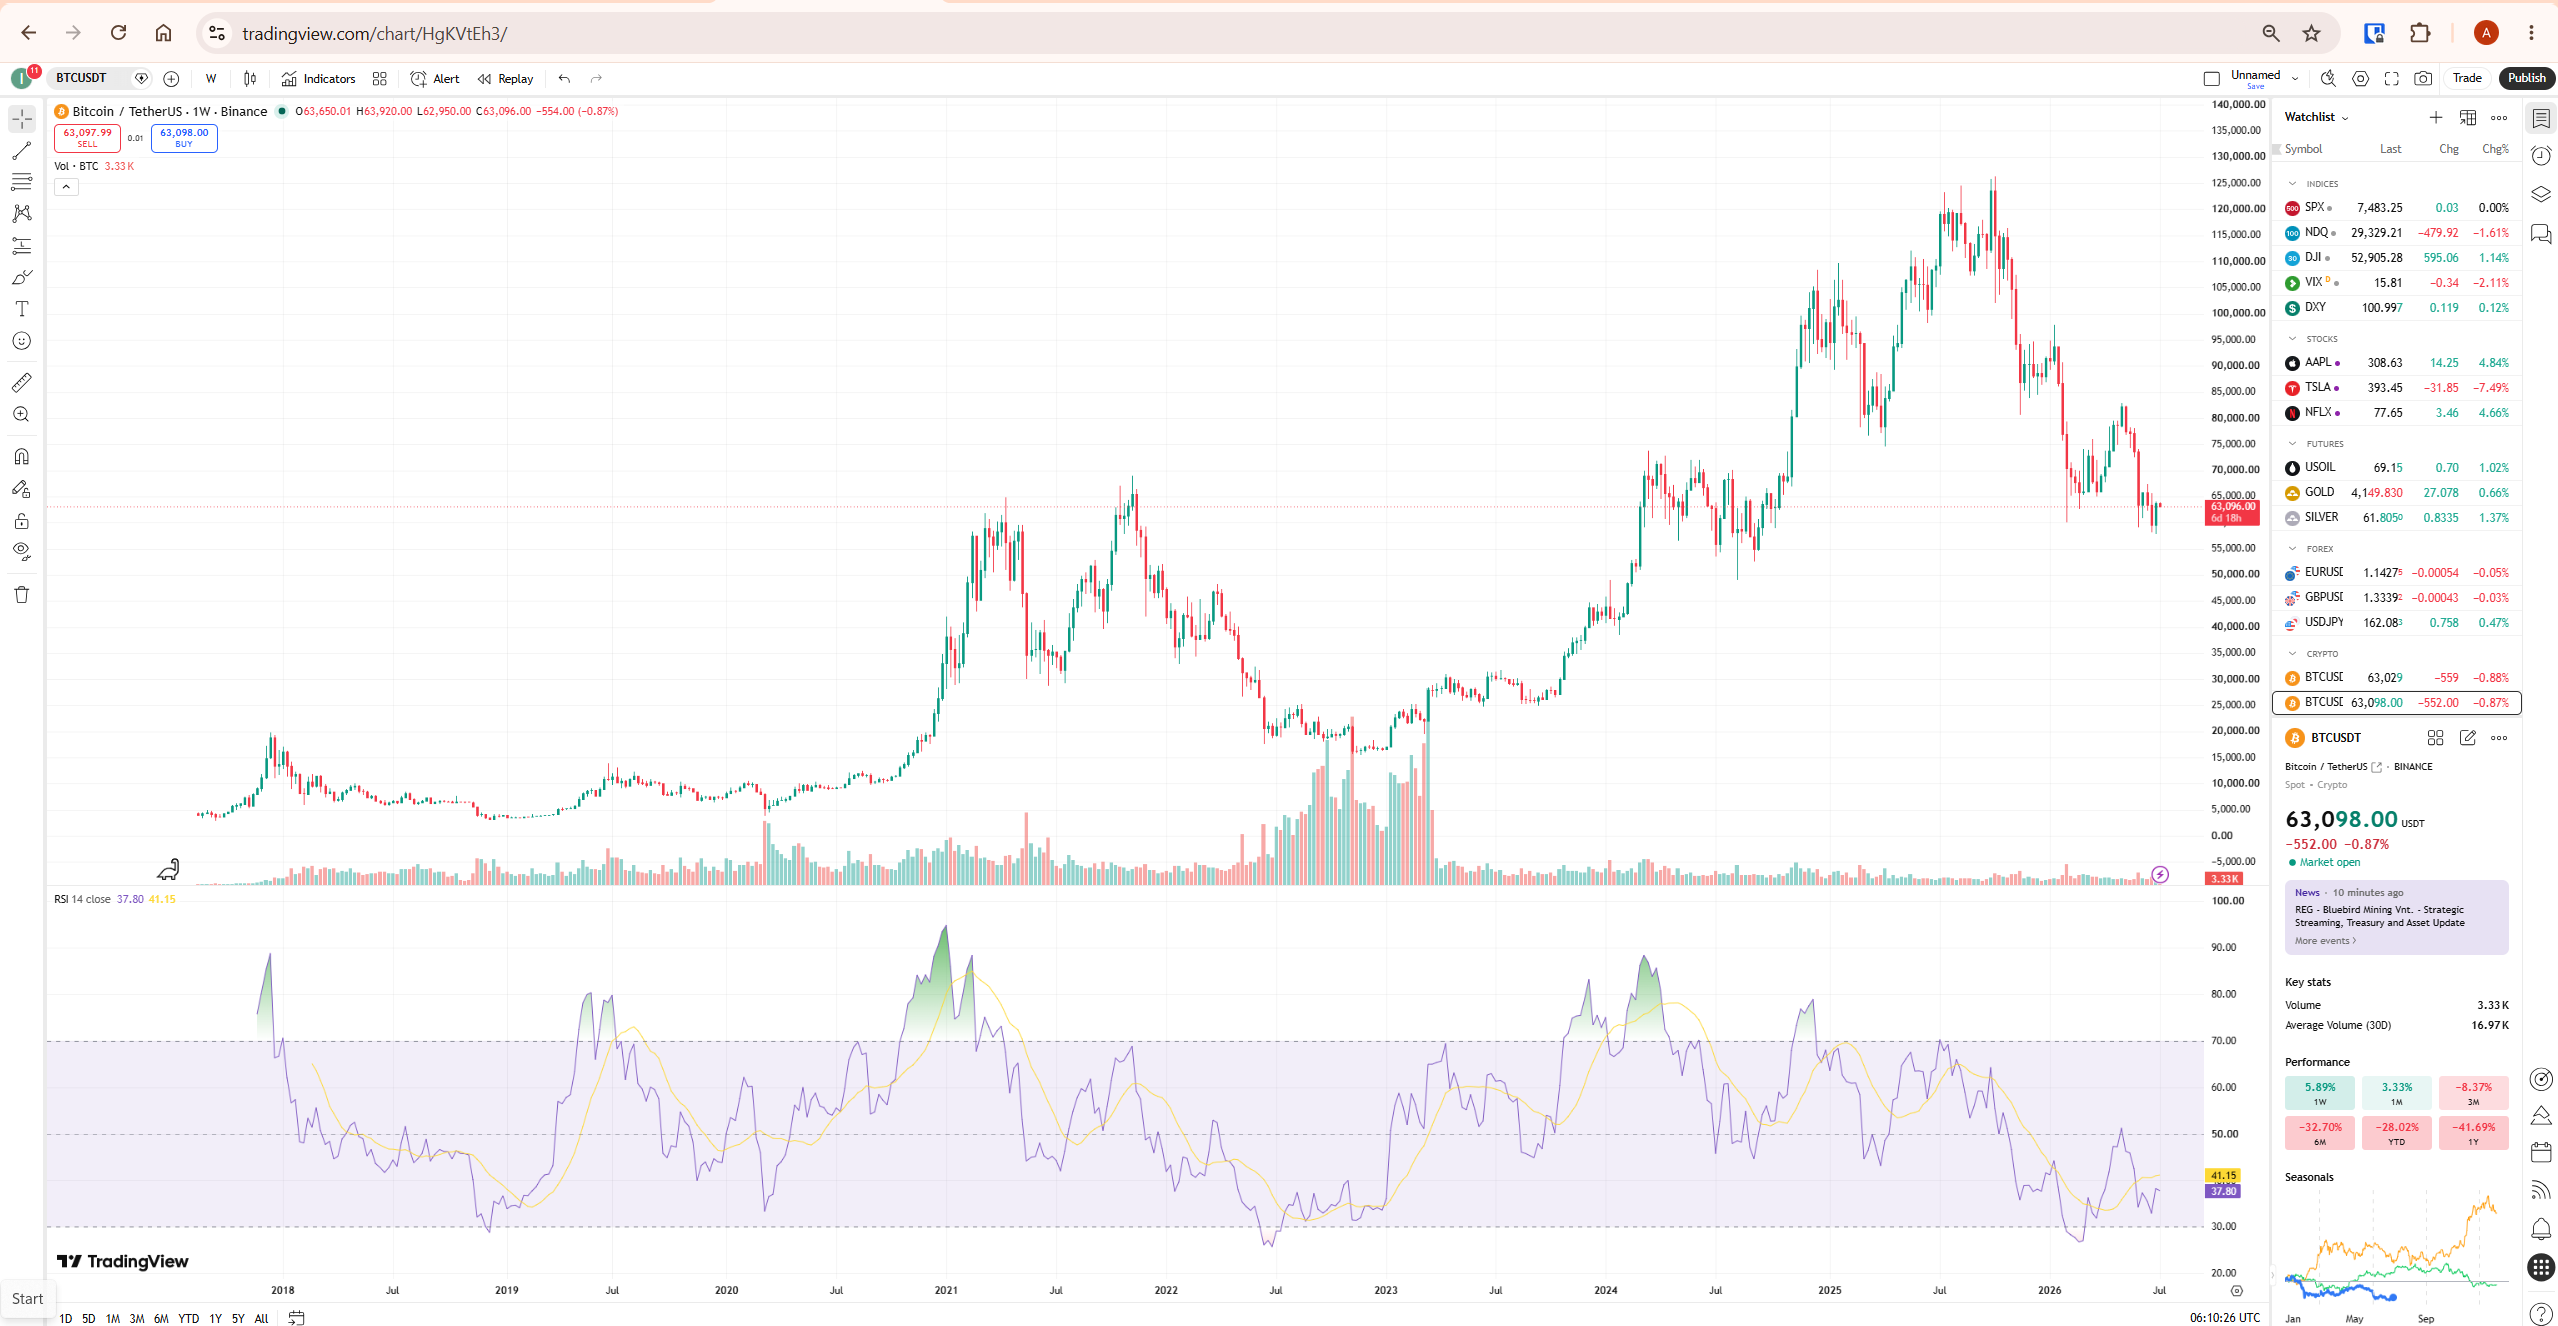
The BTC weekly chart above illustrates the concept clearly. The 2021 cycle peak shows price reaching new all-time highs while RSI was making lower highs — a bearish divergence that preceded the major 2022 downturn. This is the type of structural signal that is clearest on higher timeframes where noise is filtered out.
Using RSI Divergence Indicators on TradingView
TradingView includes an RSI Divergence indicator developed by TradingView, available from the Indicators menu under the Technicals section. It automatically detects and draws divergence lines on the chart, removing the need to manually compare price and RSI swing points on every chart.
How to add it: Click the Indicators button in the top toolbar, type “RSI Divergence” in the search box, and look under the Technicals section for the RSI Divergence indicator developed by TradingView. Click to add it. The indicator draws coloured lines directly on the RSI pane connecting the divergence pivot points — green lines for bullish divergence, red lines for bearish divergence.
Key settings worth knowing:
| Setting | Default | What It Does | Recommendation |
|---|---|---|---|
| RSI Length | 14 | Period for RSI calculation | Keep at 14 — the standard used by most traders |
| Pivot Lookback Left | 5 (typical) | Bars to the left of a pivot required to confirm it | Increase to 8–10 for fewer but higher-quality signals |
| Pivot Lookback Right | 5 (typical) | Bars to the right of a pivot required to confirm it (creates the signal delay) | Keep at 5 — this is the confirmation delay, not a flaw |
| Show Hidden Divergence | Off | Enables detection of hidden (continuation) divergence | Turn on once comfortable with regular divergence |
| Min of Lookback Range | 5 | Minimum bars between the two divergence pivots | Keep default — prevents signals on pivots that are too close |
The signal delay: The built-in indicator draws divergence lines only after the pivot has been fully confirmed — meaning it waits for the required number of bars to the right of the swing point before drawing the signal. This creates a visual delay but is a feature, not a flaw. An unconfirmed pivot that gets drawn immediately on a live bar would repaint once new data arrives. The delay ensures what you see is historically accurate.
While this guide focuses on RSI divergence specifically, the same divergence principles apply to other momentum oscillators available on TradingView. See our TradingView MACD guide for how MACD histogram divergence follows the same logic of comparing oscillator swing points against price swing points — the same skills you build here transfer directly.
This indicator is available on all TradingView plans including the free Basic tier at the time of writing. No subscription is required to use it — always verify current plan feature access at tradingview.com/pricing. For the full setup process for TradingView’s alert system — including how to set alerts when new divergences are detected — see our TradingView Alerts guide.
How to Set RSI Divergence Alerts on TradingView
Manually scanning charts for RSI divergence is time-consuming. TradingView’s alert system lets you automate this — the indicator fires an alert when a new confirmed divergence appears, so you are notified without watching charts continuously.
- Add the RSI Divergence indicator to your chart
- Right-click on the indicator name in the top-left of the chart and select Add Alert
- In the alert condition dropdown, select from the available divergence types: Bullish Divergence, Bearish Divergence, Hidden Bullish, or Hidden Bearish
- Set your preferred notification method — push notification, email, or webhook
- Set the alert to Once Per Bar Close frequency to avoid multiple alerts on the same divergence
Create separate alerts for each divergence type you want to monitor. Webhook and alert capacity depend on your plan — verify current limits at tradingview.com/pricing before building any automation workflow around alerts.

RSI Divergence in Practice: What to Look For
Detecting divergence is only half the job. The other half is knowing which divergences are worth acting on and which to ignore. After 30 years in finance, the filter I apply consistently is confluence — a divergence that aligns with multiple other factors is meaningful; a divergence in isolation is noise.
Higher timeframe divergence carries more weight. A weekly RSI divergence represents weeks of accumulated momentum change. A 5-minute divergence represents minutes. The higher the timeframe, the more significant the signal. Start with the daily and weekly charts before considering shorter timeframes.
Divergence at key structural levels is more reliable. A bearish divergence forming exactly at a major resistance level — a prior high, a Fibonacci extension level, a volume profile high-volume node — carries significantly more weight than a divergence forming in open space with no structure nearby. The structural level provides the “where” and the divergence provides the “when.”
Multiple timeframe confluence increases probability. When weekly RSI shows bearish divergence and daily RSI also shows bearish divergence at the same price area, the signal carries more weight than either timeframe alone. This multi-timeframe confirmation is one of the most reliable confluence filters available.
Wait for confirmation before entering. The divergence signals that momentum is weakening — it does not confirm that price has reversed. A confirmed reversal candle (engulfing, pin bar, or a clean close through the previous swing low/high) following a divergence is the entry trigger. The divergence is the alert; the price action is the confirmation.
For traders combining RSI divergence with volume profile levels to identify confluence zones, see our TradingView Volume Profile guide.
RSI Divergence Settings for Different Timeframes
The default RSI 14 period works well across most timeframes, but adjusting the lookback settings improves signal quality depending on how you trade.
| Trading Style | Recommended Timeframe | RSI Length | Pivot Lookback | Notes |
|---|---|---|---|---|
| Swing trading | Daily / Weekly | 14 | Left 8, Right 5 | Fewer but stronger signals — ideal starting point |
| Day trading | 1H / 4H | 14 | Left 5, Right 3 | More signals, more noise — requires stricter confirmation filters |
| Position trading | Weekly / Monthly | 14 | Left 10, Right 5 | Major structural divergences only — high conviction signals |
| Crypto swing trading | Daily / 4H | 14 | Left 7, Right 5 | BTC and ETH respond well to daily RSI divergence at cycle turning points |
Increasing the Pivot Lookback Left value forces the indicator to wait for more bars of confirmation before drawing a swing point. This reduces total signal count but increases the structural significance of each signal that does appear. Start with the default settings and adjust only once you understand which signals you are seeing on your chosen timeframe and instrument.

Common RSI Divergence Mistakes on TradingView
The most common mistake is treating divergence as an entry signal rather than an alert. A bearish divergence does not mean sell immediately — it means watch this area closely because momentum is weakening. Acting on the divergence alone without waiting for price confirmation is the fastest way to accumulate losses against a trend that has more to run.
The second mistake is counting unconfirmed pivots. If the second swing point in your divergence is still forming on a live candle, the divergence is not yet valid. The candle can close higher and reset the pivot entirely. Only draw divergence lines between fully closed bars.
The third mistake is using RSI divergence on timeframes that are too short. On 1-minute and 5-minute charts, RSI divergences form and fail constantly — the noise level is too high for the signal to carry any structural meaning. Limit divergence analysis to 1-hour charts and above for day trading, and daily charts and above for swing trading.
The fourth mistake is ignoring the broader trend direction. A regular bullish divergence in a strong downtrend is a counter-trend signal — it may produce a short-term bounce, but fading a strong trend based on divergence alone is a low-probability approach. Hidden bullish divergence in an uptrend, by contrast, aligns with the trend and is a higher-probability setup. Always know the dominant trend direction before interpreting divergence signals.
Honest Limitation: Why RSI Divergence Fails
RSI divergence fails more often than most guides acknowledge. In strongly trending markets, bearish RSI divergence can appear repeatedly while price continues to make new highs for weeks or months. Each divergence looks valid. Each one fails to produce a reversal. Traders who short every bearish divergence in a strong uptrend learn this lesson expensively.
The underlying reason is that RSI divergence measures the rate of change in momentum, not the absolute level of buying or selling pressure. In a strong trend, momentum naturally decelerates as price extends — but deceleration is not reversal. Price can continue making new highs on declining RSI for an extended period before a genuine reversal occurs. The divergence is telling you the trend is ageing, not that it is over.
A further limitation: divergence signals have a confirmation delay by design. By the time the divergence is confirmed and drawn on the chart, the optimal entry point may have already passed. Traders who chase confirmation late often enter near the end of the anticipated move rather than the beginning.
The correct framing: RSI divergence is one input in a multi-factor analysis — not a complete trading system. Use it to identify areas of potential momentum change, then require additional confirmation from price structure, volume, or other indicators before acting. For further context on how professional traders integrate RSI divergence into broader analytical frameworks, Investopedia’s RSI guide covers the indicator’s mechanics and limitations clearly. For independent analysis of divergence-based strategies, BabyPips covers divergence trading in practical detail.
What To Do Next
Open TradingView, add the built-in RSI Divergence indicator to any daily chart you follow — Bitcoin, a major stock index, or a currency pair. Set the lookback to Left 8, Right 5. Scroll back through at least two years of chart history and identify every confirmed divergence signal. Note which ones preceded actual reversals and which ones failed. Do this before trading on any live divergence signal. That historical review will show you exactly how the tool behaves on your specific instrument and timeframe — and it will prevent the most expensive mistake: trusting a divergence signal you do not yet understand.
Related TradingView Guides
- TradingView MACD — the same divergence principles applied to a second momentum oscillator
- Best TradingView Indicators for Crypto — how RSI fits into a complete multi-indicator setup
- TradingView Alerts Explained — how to automate RSI divergence detection with alerts
- TradingView Volume Profile — combining volume structure with RSI divergence for higher-confluence signals
- TradingView Strategy Tester — how to backtest RSI divergence-based strategies on historical data
- TradingView Review 2026 — complete platform overview
Frequently Asked Questions
What is RSI divergence on TradingView?
RSI divergence on TradingView occurs when the price of an asset and the RSI indicator move in opposite directions at swing points. Regular bullish divergence — price making a lower low while RSI makes a higher low — signals weakening downside momentum and a potential reversal upward. Regular bearish divergence — price making a higher high while RSI makes a lower high — signals weakening upside momentum. TradingView has a free built-in indicator that automatically detects and draws these divergences on any chart.
Is RSI divergence reliable?
RSI divergence is useful as a momentum warning signal but unreliable as a standalone trading trigger. In strongly trending markets, bearish divergence can appear repeatedly while price continues to make new highs — producing a sequence of valid-looking signals that all fail to produce reversals. Divergence is most reliable when it occurs at key structural levels (major resistance, Fibonacci extensions, volume profile nodes), aligns across multiple timeframes, and is followed by confirmation from price action before a position is taken.
What is hidden divergence and how is it different from regular divergence?
Regular divergence signals potential trend reversals — it appears at the end of a price move when momentum is exhausted. Hidden divergence signals trend continuation — it appears during a pullback or bounce within an existing trend, suggesting the original trend is about to resume. Hidden bullish divergence: price makes a higher low (uptrend intact) while RSI makes a lower low — a signal to buy the pullback. Hidden bearish divergence: price makes a lower high (downtrend intact) while RSI makes a higher high — a signal to sell the bounce. Many traders prefer hidden divergence because it aligns with the prevailing trend rather than trading against it.
How do I add the RSI divergence indicator on TradingView?
Click the Indicators button in the top toolbar of any TradingView chart, type “RSI Divergence” in the search box, and select the indicator from the Technicals section. It adds the RSI panel to the bottom of your chart and automatically draws coloured divergence lines — green for bullish, red for bearish — on confirmed pivots. At the time of writing, the indicator is available on all plans including Basic — verify current availability at TradingView’s pricing page. To enable hidden divergence detection, open the indicator settings and turn on the Show Hidden Divergence option.
Why does the RSI divergence indicator show signals with a delay?
The delay is intentional. The indicator waits for the pivot to be fully confirmed — a set number of bars must close to the right of the swing point before the divergence is drawn. This prevents the indicator from drawing signals on unconfirmed live candles that could repaint when new data arrives. The delay means you see slightly later signals, but those signals are historically accurate and will not disappear or change after they are drawn.
What RSI settings work best for divergence?
The default 14-period RSI works well for most divergence analysis. For swing trading on daily charts, increase the Pivot Lookback Left to 8 — this produces fewer signals but increases the structural significance of each one. For day trading on 1H or 4H charts, the default settings of Left 5, Right 5 are a reasonable starting point. Avoid reducing the RSI period below 9 for divergence analysis — shorter periods generate excessive noise that makes divergence identification unreliable.
Can I set alerts for RSI divergence on TradingView?
Yes. With the RSI Divergence indicator added to your chart, right-click the indicator name and select Add Alert. Choose the divergence type you want to monitor — bullish, bearish, hidden bullish, or hidden bearish — and set your notification preference. Use Once Per Bar Close frequency to avoid duplicate alerts. Alert capacity and webhook availability depend on your plan — verify current limits at tradingview.com/pricing.
Trading disclaimer: Trading involves risk. This article is for educational purposes only and is not financial advice. Technical analysis tools do not guarantee profitable results. Past performance is not indicative of future results. Always manage your risk appropriately.
