
TradingView Pine Script Strategies: Best Complete Guide (2026)
Affiliate Disclosure: This article contains affiliate links. If you sign up for TradingView through a link on this page, I may earn a commission at no extra cost to you. I only recommend tools I have researched and believe are relevant to the reader’s use case.
Trading involves risk. This article is for educational purposes only and is not financial advice. Technical analysis tools do not guarantee profitable results. Past performance is not indicative of future results. Always manage your risk appropriately.
Last verified: August 2026, using TradingView’s official Pine Script v6 reference and Strategy Tester documentation.
TradingView Pine Script strategies — and Pine Script strategies generally — let you turn a trading idea into a backtestable rule set instead of a subjective visual read of a chart, and the tools required — the Pine Editor and Strategy Tester — are free on every plan including Basic. I am Andreas Maratheftis, and after 30 years in professional finance I can tell you the gap between a strategy that looks good on a backtest and one that survives live trading is usually not the code itself — it is the unrealistic assumptions baked into how the backtest was run. This guide to Pine Script strategies covers the difference between an indicator and a strategy, how to write a basic strategy from scratch, the inputs that make backtests either useful or misleading, and the honest limitation every Pine Script strategy shares.
Key Takeaways
- A Pine Script strategy differs from an indicator by declaring
strategy()instead ofindicator()— this unlocks backtesting, but strategies cannot plot on the price scale the same way indicators can without extra work - Every script must start with
//@version=6— verify syntax against the official v6 reference, since older tutorials often use outdated syntax - The Strategy Tester is free on all plans and shows key metrics: net profit, max drawdown, win rate, and profit factor
- Backtest realism depends heavily on commission, slippage, and position sizing settings — most inflated backtests come from ignoring these, not from the trading logic itself
- A strategy that backtests well is not the same as a strategy that will perform well live — always paper trade before risking real capital
Quick Answer
A Pine Script strategy is a script written in TradingView’s built-in language that declares entry and exit rules using strategy.entry() and strategy.close() functions, allowing it to be backtested through the Strategy Tester panel. This differs from a Pine Script indicator, which only plots visual information on the chart and cannot generate a backtest report. Writing a basic strategy takes roughly 15 lines of code — a moving average crossover is the standard starting example. The Pine Editor and Strategy Tester are both free on every TradingView plan including Basic. The single biggest risk in strategy development is producing an unrealistic backtest by ignoring commission, slippage, and position sizing — a strategy can look highly profitable on paper and lose money immediately once those real-world costs are accounted for.
Open TradingView free and start writing your first Pine Script strategy today.
Indicator vs Strategy: The Core Difference
Every Pine Script begins with a declaration line that tells TradingView what type of script it is. An indicator script begins with indicator() and is designed to plot visual information — lines, histograms, labels — on or below the price chart. A strategy script begins with strategy() and adds a specific set of functions for entering and exiting simulated trades, which the platform then evaluates against historical price data to produce a backtest report.
The practical distinction matters because the two script types serve different purposes. An indicator tells you something about the market — is momentum rising, is volatility contracting. A strategy goes one step further and defines exactly when you would have entered and exited a position based on that information, then measures what would have happened.
| Aspect | Indicator | Strategy |
|---|---|---|
| Declaration | indicator() | strategy() |
| Purpose | Plots visual information on the chart | Simulates entries and exits based on rules |
| Backtestable | No | Yes — through the Strategy Tester panel |
| Can trigger alerts | Yes | Yes |
| Key functions | plot(), plotshape() | strategy.entry(), strategy.close(), strategy.exit() |
You can convert most indicators into Pine Script strategies by adding entry and exit logic around the same underlying calculation — the moving average, the RSI level, the crossover — you were already plotting. The signal logic often stays identical; what changes is whether the script simply shows you the signal or actually simulates trading on it.
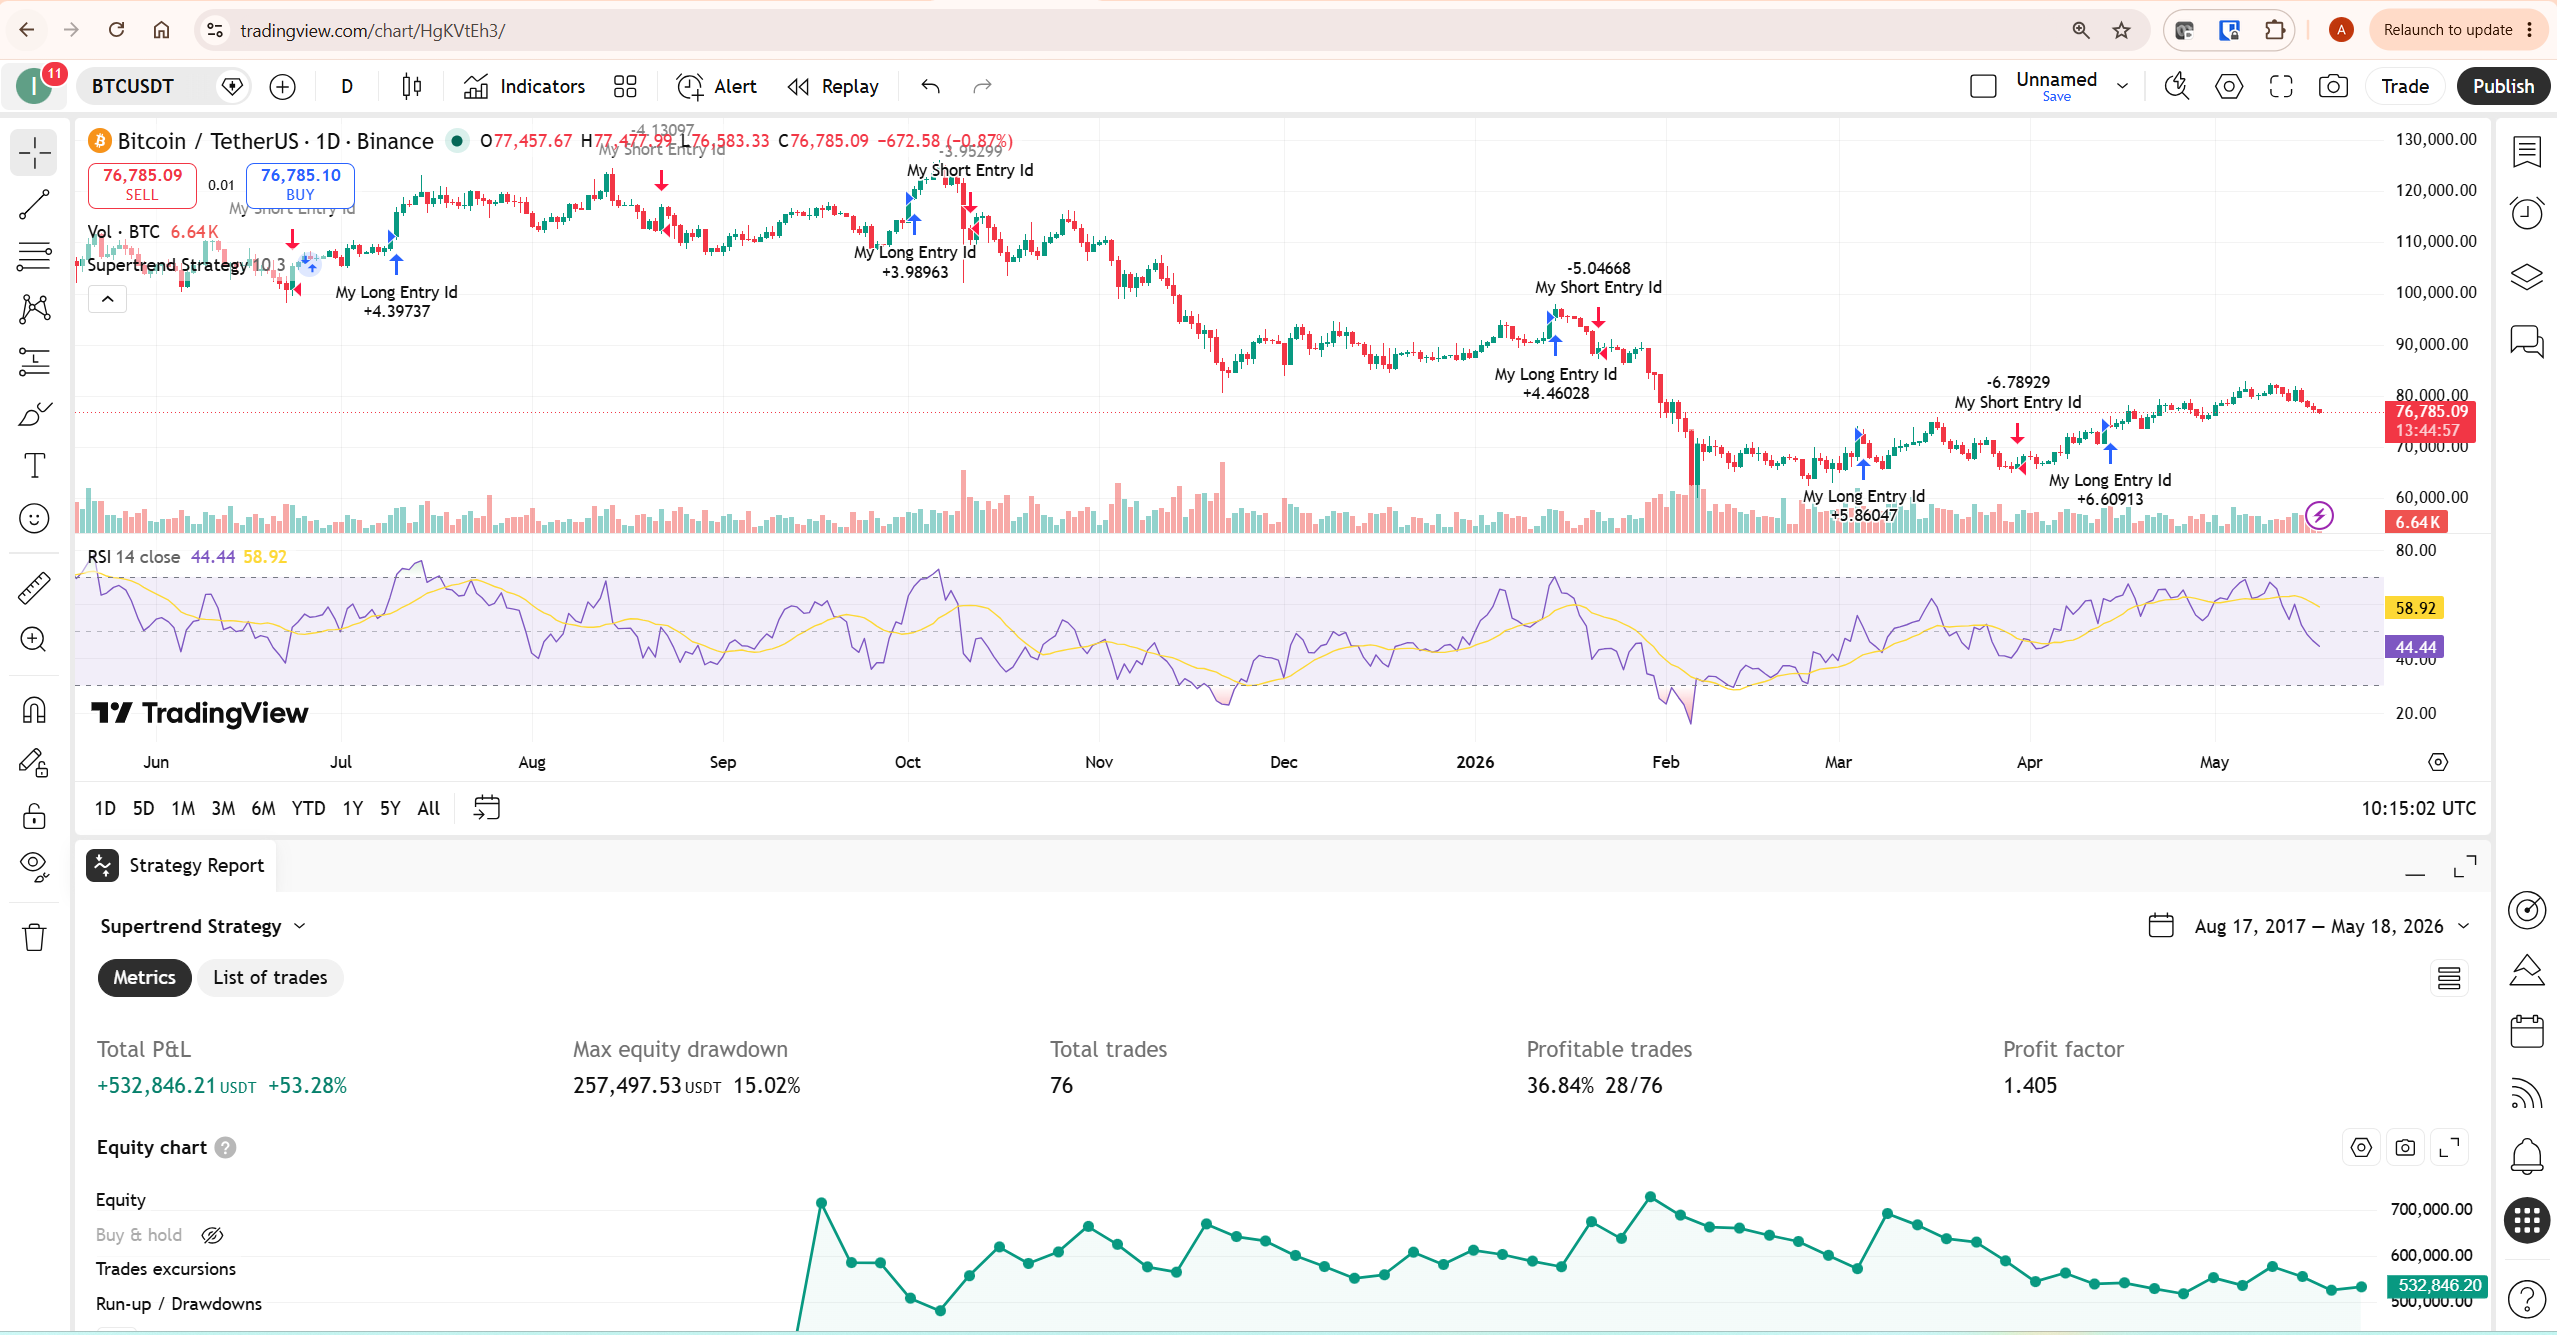
Writing Your First Pine Script Strategy
Every script must start with the version declaration //@version=6 — verify this and all subsequent syntax against the official Pine Script v6 reference, since tutorials written for earlier versions frequently use syntax that no longer compiles correctly.
Here is a basic moving average crossover, one of the simplest Pine Script strategies — one of the simplest strategy structures and a common starting point for learning the core functions:
//@version=6
strategy("MA Crossover Strategy", overlay=true)

fastLength = input.int(9, "Fast MA Length")
slowLength = input.int(21, "Slow MA Length")

fastMA = ta.sma(close, fastLength)
slowMA = ta.sma(close, slowLength)

plot(fastMA, color=color.blue)
plot(slowMA, color=color.orange)

longCondition = ta.crossover(fastMA, slowMA)
shortCondition = ta.crossunder(fastMA, slowMA)

if longCondition
    strategy.entry("Long", strategy.long)

if shortCondition
    strategy.close("Long")
Pine Script code disclaimer: this script is for educational purposes only. Test any script in paper trading first, and always verify syntax against the official v6 reference before relying on it.
Breaking down what each part does: input.int() creates adjustable parameters that appear in the strategy’s settings panel rather than being hardcoded, letting you test different values without editing code. ta.sma() calculates the simple moving average. ta.crossover() and ta.crossunder() detect when one line crosses above or below another. strategy.entry() opens a simulated long position, and strategy.close() exits it.
To run this: open the Pine Editor (the side panel accessible from the bottom of any chart), paste the script, click Add to Chart, then open the Strategy Tester panel to see the backtest results.
Reading the Strategy Tester Results
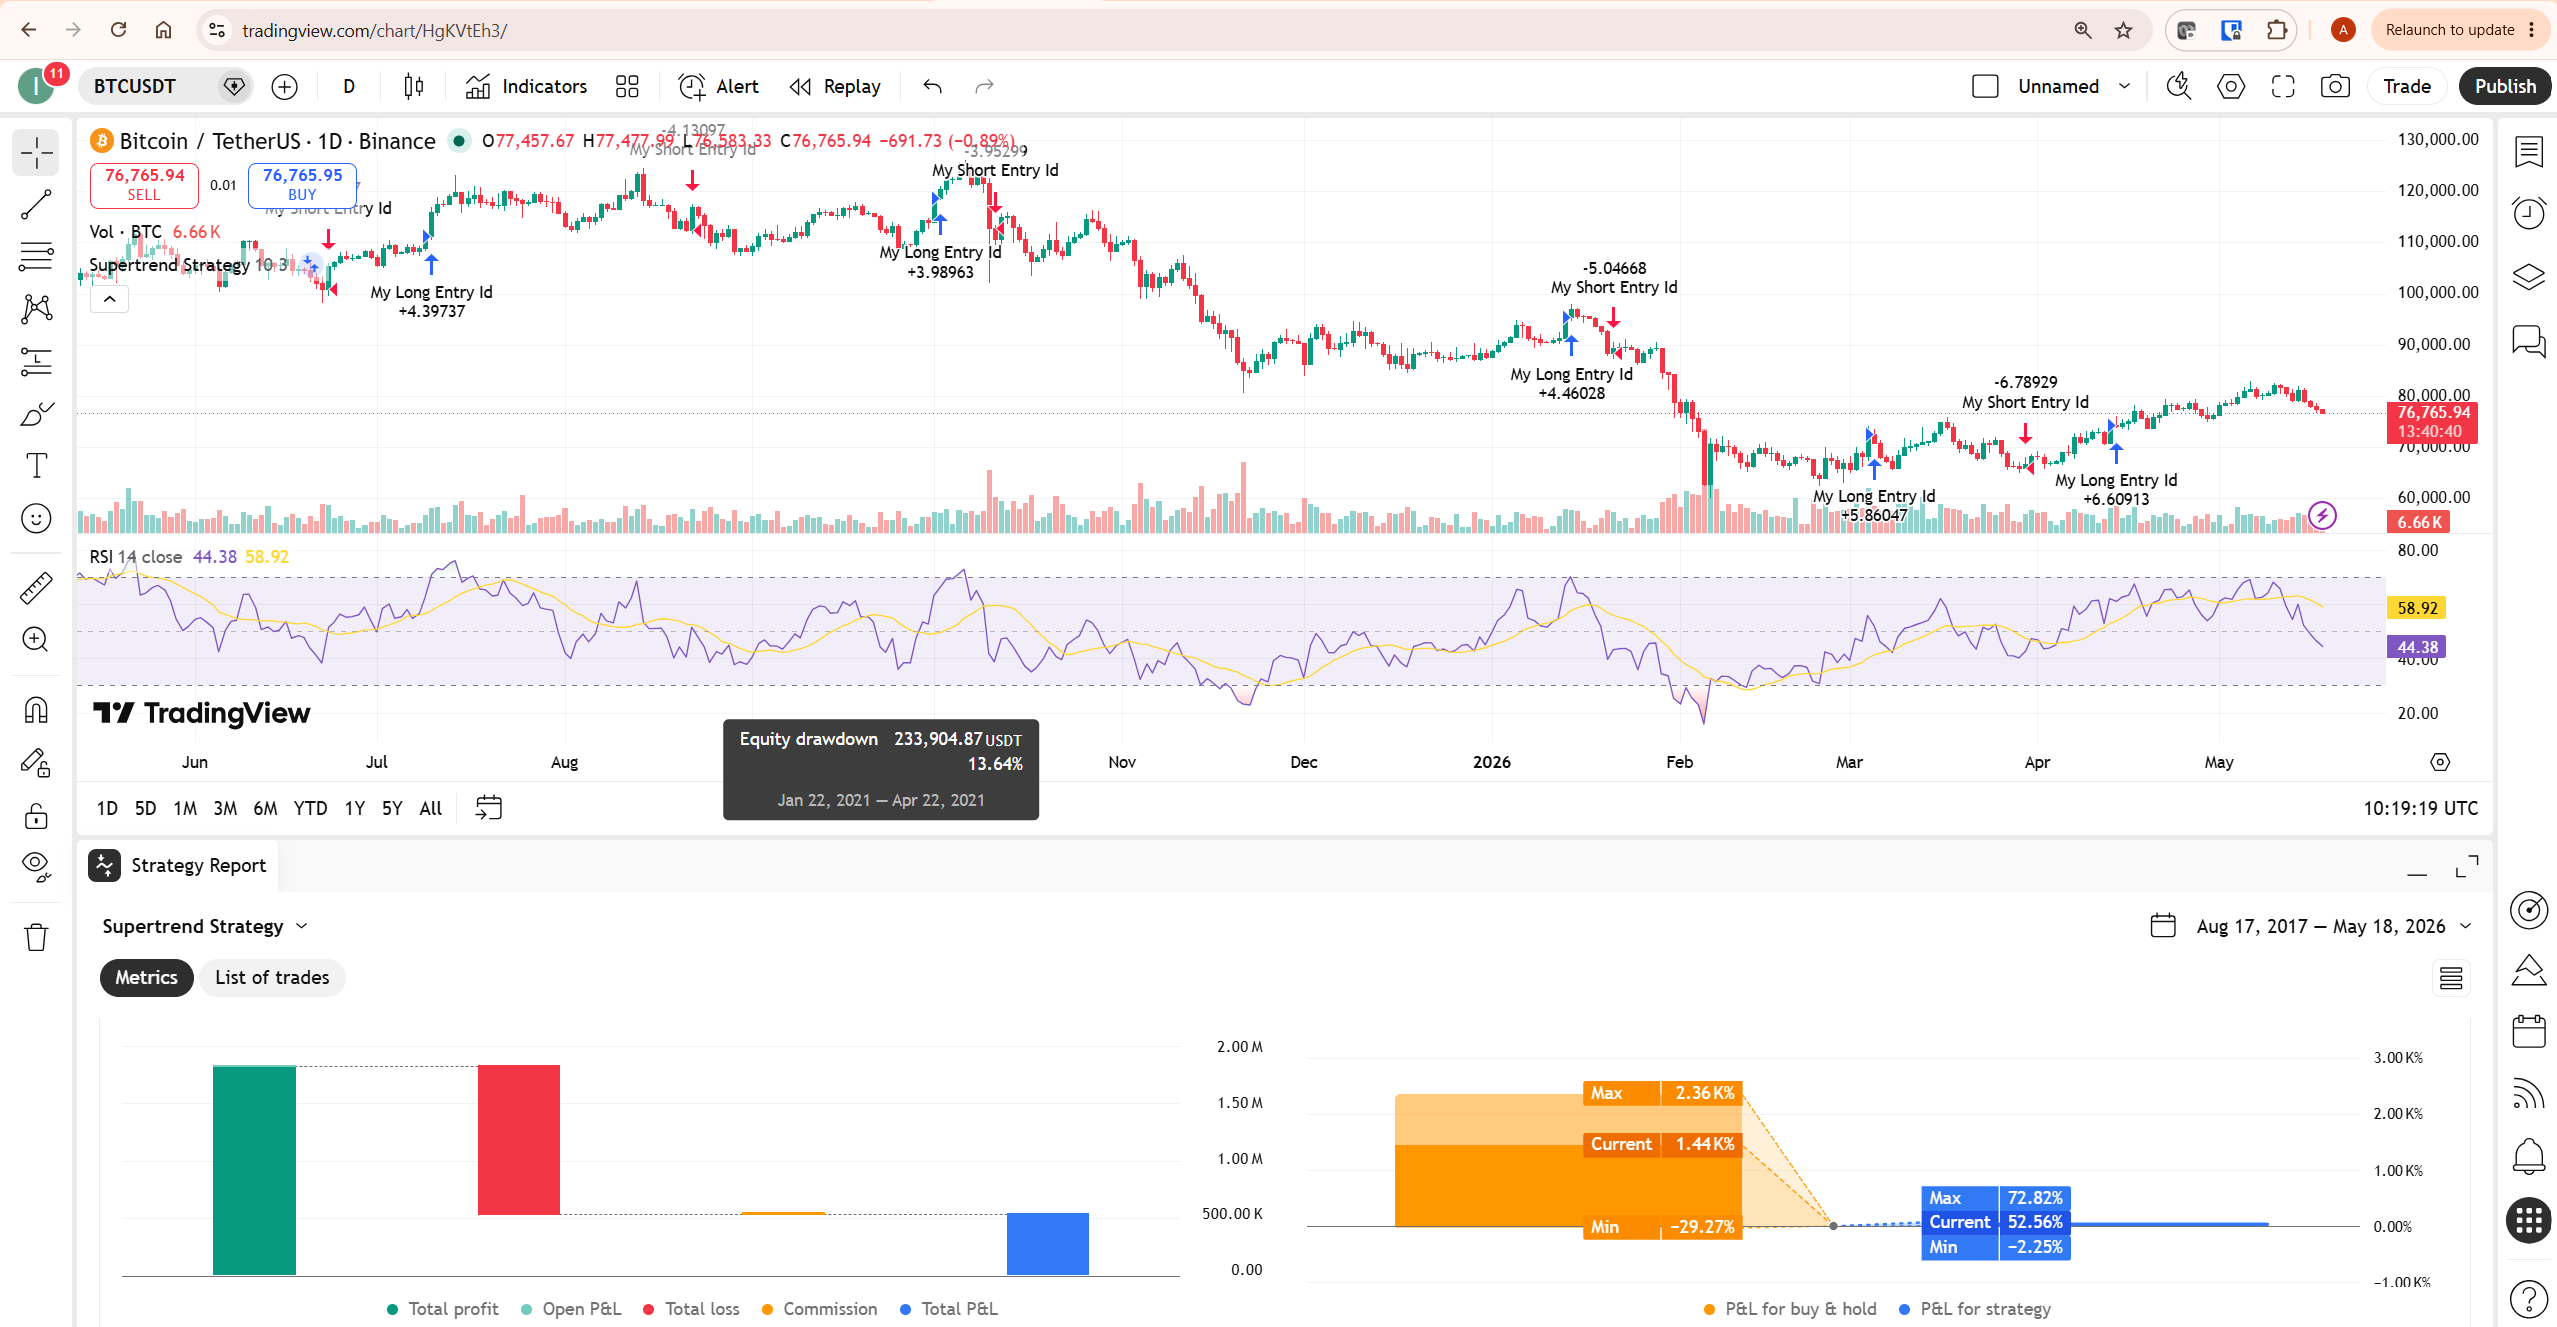
Once one of your Pine Script strategies is applied to a chart, the Strategy Tester panel opens automatically at the bottom of the screen, showing a set of performance metrics calculated from every simulated trade the strategy took across the visible chart history.
| Metric | What It Measures | What to Watch For |
|---|---|---|
| Net Profit | Total profit or loss across all simulated trades | A positive number alone means little without context on drawdown and trade count |
| Max Drawdown | The largest peak-to-trough decline in account equity during the test period | A strategy with high net profit but severe drawdown may be unusable in practice due to psychological and risk-of-ruin factors |
| Win Rate | Percentage of trades that closed profitably | A low win rate is not necessarily bad if average winners are much larger than average losers |
| Profit Factor | Gross profit divided by gross loss | Above 1.0 means the strategy was profitable overall; values below 1.5 are often considered fragile |
| Number of Trades | Total simulated trades in the test period | A small sample size (fewer than 30–50 trades) makes any statistic unreliable regardless of how good it looks |
When evaluating Pine Script strategies, no single metric tells the full story. A strategy with an excellent profit factor but only 12 trades over five years of data has not been meaningfully tested — there simply is not enough sample size to draw a reliable conclusion. See our TradingView Strategy Tester guide for a complete walkthrough of every available metric and how to interpret them together.
Making Backtests Realistic: Commission and Slippage
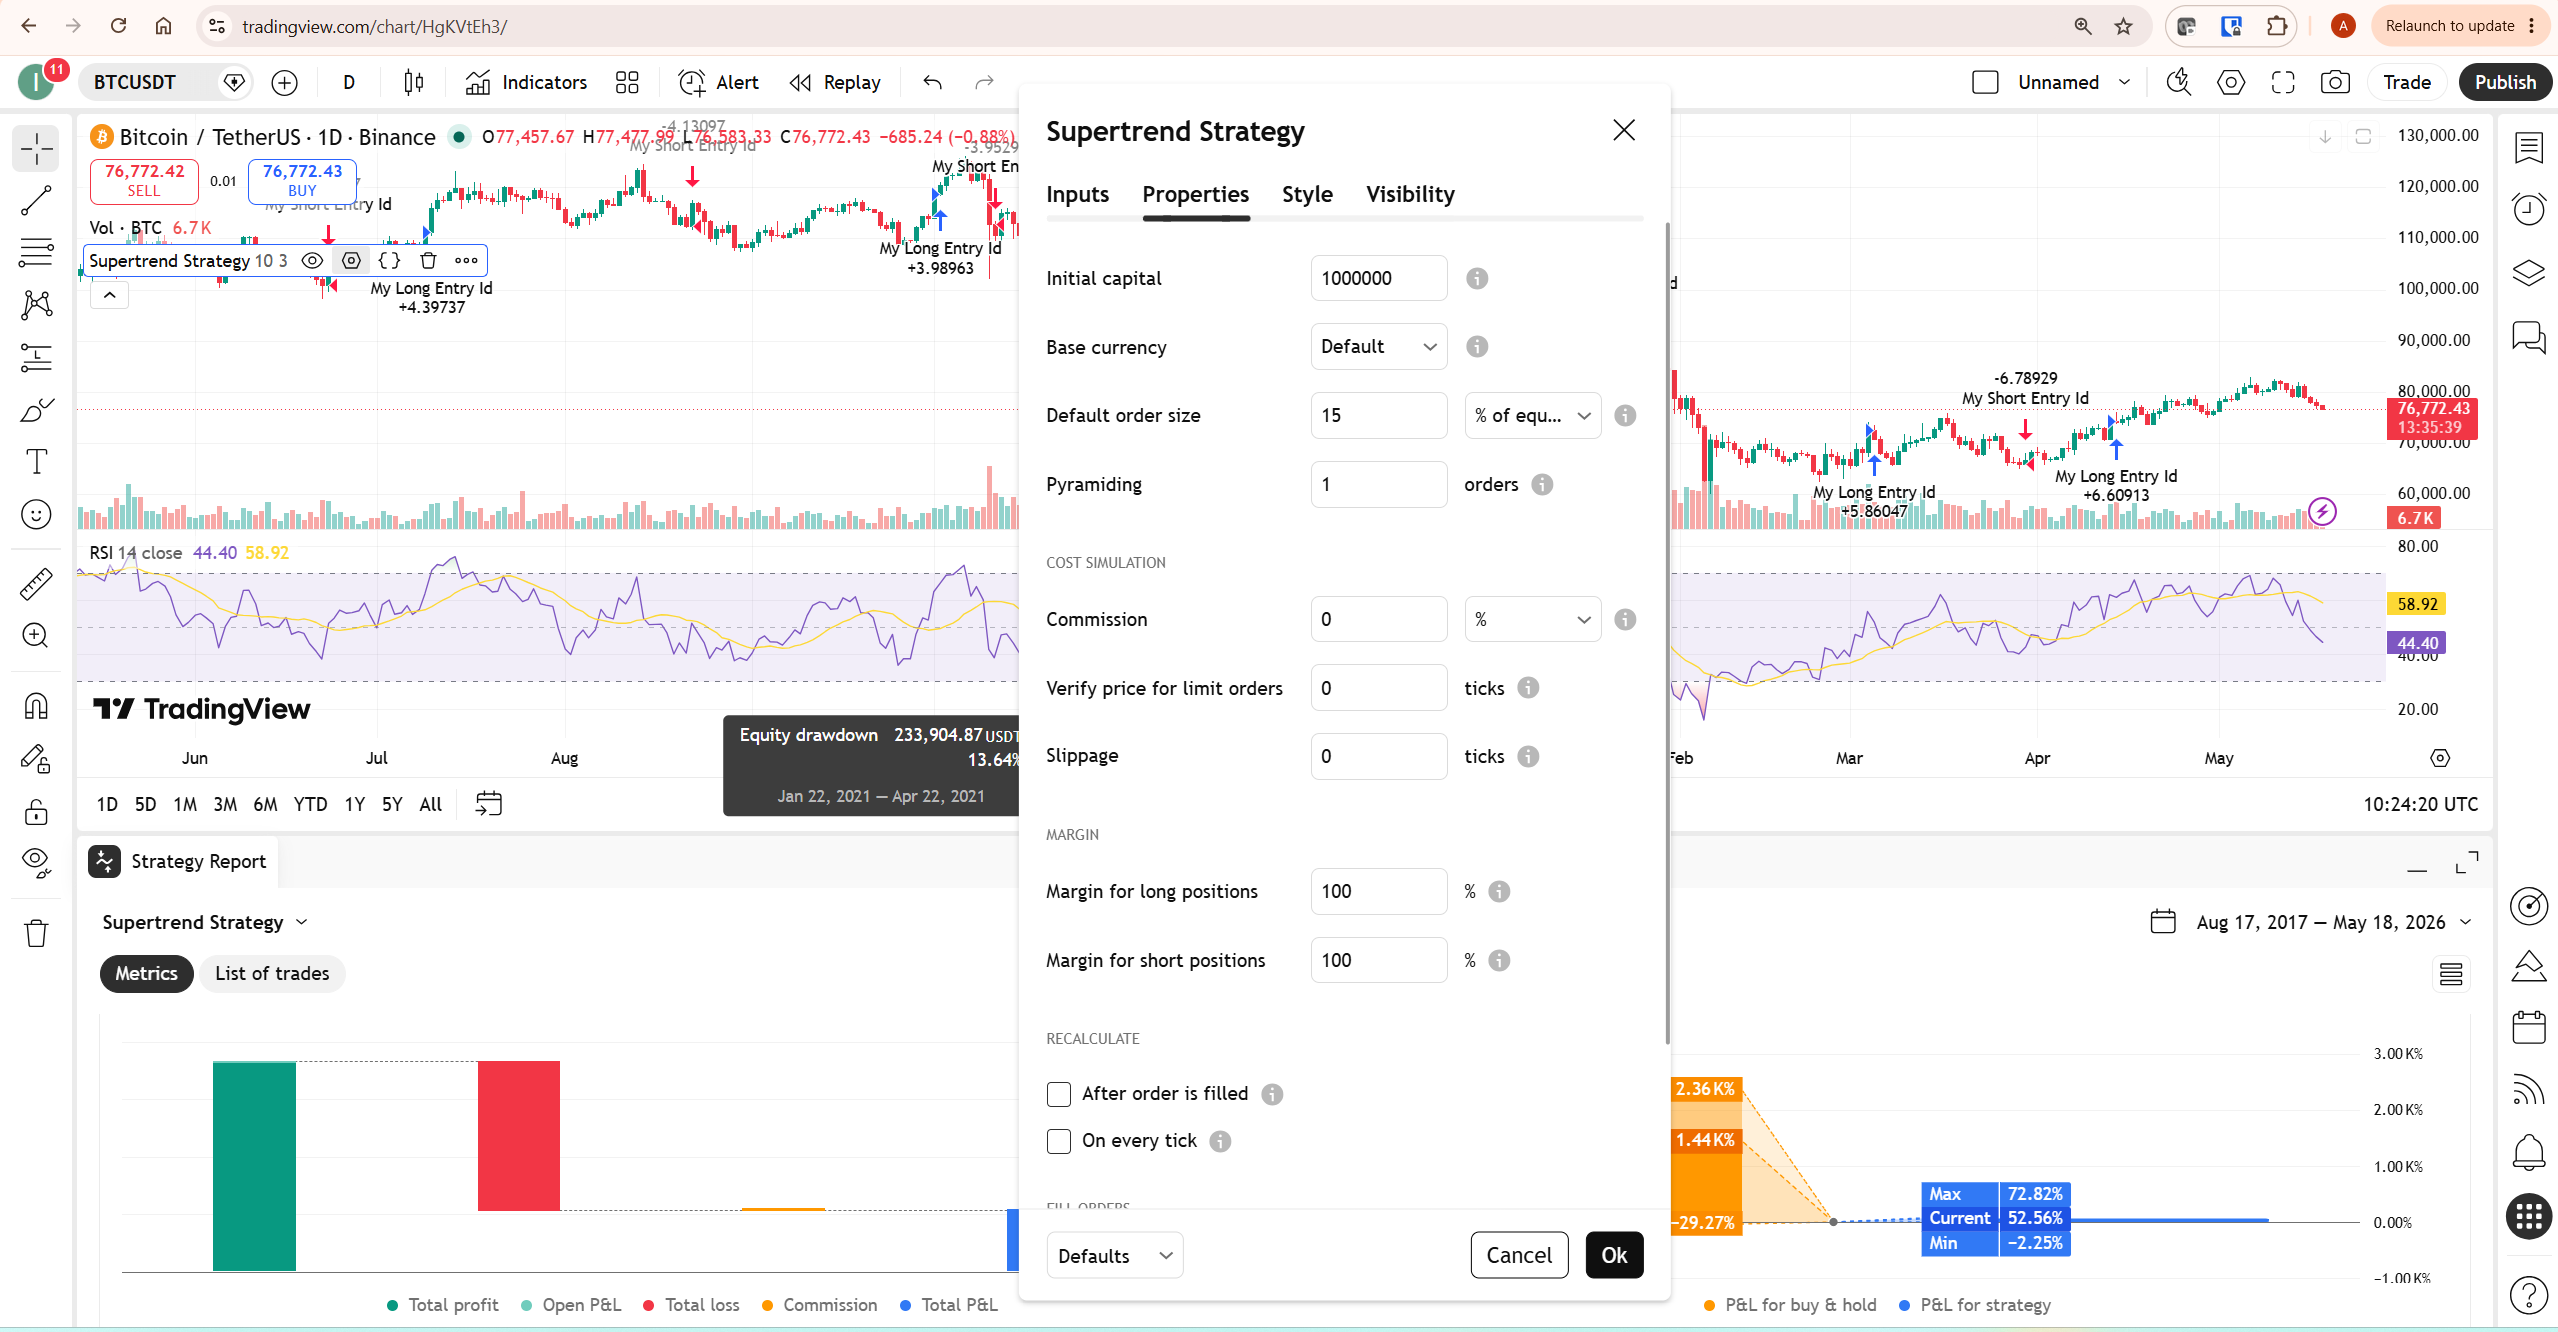
The single most common reason a promising backtest fails to translate into live results is that the backtest ignored the real-world costs of trading. By default, TradingView’s Strategy Tester assumes zero commission and zero slippage unless you configure otherwise — meaning every simulated trade fills at exactly the price the strategy requested, with no fees.
Configure realistic values in the strategy’s Properties settings before trusting any backtest result. A typical starting point: set commission to match your actual broker or exchange fee structure, and add a small slippage value (often a few ticks) to account for the difference between the requested price and the actual fill price during live execution. A strategy that produces dozens of small, frequent trades is far more sensitive to these costs than one that produces a handful of large, infrequent trades — high-frequency strategies in particular can look highly profitable with zero costs and become unprofitable the moment realistic commission is added.
Position sizing is the other frequently overlooked setting across most Pine Script strategies. By default, TradingView risks a fixed percentage of equity or a fixed contract count per trade — verify this matches how you actually intend to size positions, since unrealistic position sizing can dramatically distort both the profit figures and the drawdown figures shown in the backtest.
Avoiding Repainting in Strategy Logic
Repainting is a particularly serious problem in strategy scripts because it can produce a backtest that looks excellent using information the strategy would not have actually had access to at the time of the simulated trade — for example, calculating a signal using the high or low of a bar before that bar has actually closed.
The most common cause is referencing high, low, or other values from the current, still-forming bar rather than the most recently closed bar. Using barstate.isconfirmed to ensure logic only evaluates on a confirmed, closed bar — rather than reacting to intrabar price movement — is one of the standard techniques for keeping a strategy’s backtest results honest and reproducible in live conditions.
If any of your Pine Script strategies show live performance diverging sharply from their backtest despite realistic commission and slippage settings, repainting logic is one of the first things to investigate — it is a common enough issue that experienced Pine Script developers check for it by default when a backtest looks unusually strong.
Setting Alerts on Pine Script Strategies
Pine Script strategies can trigger TradingView alerts the same way an indicator can, notifying you whenever the strategy’s logic would have opened or closed a simulated position — useful for semi-automated trading where you want notification of a signal without full automation.
- Apply the strategy script to your chart
- Click the Alert (clock) icon in the top toolbar
- Set the condition to the strategy name, which exposes entry and exit events as alert triggers
- Choose your notification method — push, email, or webhook, depending on your plan
- For automated execution via webhook, format the alert message to match the syntax your third-party automation tool or broker connection expects
For the complete alert setup process for Pine Script strategies across all TradingView plans, see our TradingView Alerts Explained guide. Webhook availability and alert capacity depend on your plan — verify current limits at tradingview.com/pricing.
Common Pine Script Strategy Mistakes
The most common and costly mistake with Pine Script strategies is trusting a backtest run with zero commission and zero slippage. This single oversight is responsible for more disappointing live results than any flaw in the actual trading logic — always configure realistic transaction costs before drawing any conclusion from a backtest.
The second mistake is overfitting a strategy to a specific historical period by adjusting parameters repeatedly until the backtest looks ideal on that exact dataset. A strategy tuned this precisely to past data frequently fails to generalise to future, unseen market conditions — a phenomenon sometimes called curve fitting. Testing across multiple, distinct time periods and multiple instruments provides a more honest read of whether a strategy has genuine edge or has simply been fit to noise.
The third mistake is drawing conclusions from too small a sample size. A handful of trades over a short backtest period cannot reliably distinguish a genuinely edge-having strategy from one that got lucky. Testing across a longer history and a larger number of trades is necessary before any statistic from the Strategy Tester should be trusted.
The fourth mistake is skipping paper trading entirely and moving straight from backtest to live capital. A strategy that performs well in backtesting has only been tested against historical data it never had to react to in real time — paper trading exposes execution issues, alert delivery gaps, and psychological factors that a backtest cannot reveal.
Honest Limitation: Why Good Backtests Fail Live
Every one of these Pine Script strategies shares the same fundamental limitation: a backtest measures how a defined set of rules would have performed on data that has already happened. It cannot measure how those rules will perform on data that has not happened yet, and market conditions change in ways that historical data cannot fully anticipate — volatility regimes shift, liquidity conditions change, and the underlying market structure itself evolves over time.
This is not a flaw specific to TradingView’s implementation or to any particular strategy’s logic. It is a structural limitation of backtesting as a method, and no amount of parameter tuning eliminates it — tuning a strategy more precisely to historical data typically makes the overfitting problem worse, not better, even as the backtest numbers themselves look increasingly impressive.
A further limitation specific to these Pine Script strategies is that the Strategy Tester simulates fills based on the price data available at the time — in fast-moving or thinly traded markets, actual live fills can differ meaningfully from the price a backtest assumes, particularly for strategies trading smaller or less liquid instruments where genuine slippage can exceed the estimate configured in the backtest settings.
The responsible framing: treat a strong backtest as a reason to move to paper trading, not as a reason to move directly to live capital. A strategy that survives realistic commission and slippage assumptions, a reasonable sample size, and a subsequent period of paper trading has cleared meaningfully more validation than one that has only been backtested once with default settings. For deeper context on rigorous backtesting methodology, Investopedia’s backtesting guide covers the general principles that apply beyond TradingView specifically. For an independent overview of TradingView’s broader charting and scripting toolkit, the StockBrokers.com TradingView review provides useful third-party context.
What To Do Next
When building Pine Script strategies, open the Pine Editor on TradingView and type out — rather than copy and paste — the moving average crossover strategy from this guide. Typing each line manually builds a working familiarity with the syntax that copy-pasting does not. Once it compiles and runs, open the strategy’s Properties settings and configure realistic commission and slippage values for the instrument you actually trade. Compare the backtest results before and after adding those costs — the difference will show you directly how much of the strategy’s apparent edge depends on ignoring real-world trading costs.
Related TradingView Guides
- Pine Script Tutorial for Beginners — start here if you are new to Pine Script and want to build indicators before strategies
- TradingView Strategy Tester — complete guide to every metric in the Strategy Tester panel
- TradingView Alerts Explained — setting up alerts and webhooks for strategy signals
- TradingView MACD — a common signal used as the basis for crossover strategies
- TradingView Review 2026 — complete platform overview
Frequently Asked Questions
What is the difference between a Pine Script indicator and a strategy?
An indicator, declared with indicator(), plots visual information on the chart but cannot be backtested. A strategy, declared with strategy(), adds entry and exit functions that let TradingView simulate trades based on the script’s rules and produce a backtest report through the Strategy Tester panel. Both can trigger alerts, but only strategies generate performance metrics like net profit, drawdown, and win rate.
Do I need to know how to code to write a Pine Script strategy?
Basic Pine Script strategies require minimal coding experience — the language is deliberately narrow in scope compared to general-purpose programming languages, and simple strategies like a moving average crossover can be written in roughly 15 lines of code. Traders with no prior coding background can typically learn the core syntax within a few hours of practice. Understanding basic trading concepts — what a crossover means, what an entry and exit represent — matters more initially than programming experience.
Is the TradingView Strategy Tester free?
Yes. The Pine Editor and Strategy Tester are both available on the free Basic TradingView plan at no cost. At the time of writing no subscription is required to write and backtest Pine Script strategies. Paid plans mainly affect broader workflow limits such as the number of indicators per chart and alert capacity, not access to strategy scripting itself. Always verify current plan features at tradingview.com/pricing.
Why does my strategy backtest well but lose money live?
This is one of the most common experiences in strategy development and usually traces back to one of a few causes: the backtest was run without realistic commission and slippage, the strategy was overfit to a specific historical period through excessive parameter tuning, the sample size was too small to be statistically meaningful, or the underlying market conditions have genuinely changed since the backtest period. Configuring realistic transaction costs and testing across multiple distinct time periods before going live addresses the first three causes directly.
Can Pine Script strategies place live trades automatically?
Not directly. Pine Script strategies run on TradingView’s servers and simulate trades for backtesting and alerting purposes, but they cannot place live orders on an exchange by themselves. Live automation requires connecting a strategy’s alerts to a broker integration or a third-party automation bridge via webhook, which then executes the actual trade based on the alert signal. Always test any automated execution setup thoroughly with small position sizes before relying on it with significant capital.
What does repainting mean in a Pine Script strategy?
Repainting occurs when a script’s logic uses information from a bar that has not yet closed, producing backtest results that reflect data the strategy would not have actually had access to at the time of a live trade. This typically happens when a script references the high, low, or close of the current, still-forming bar rather than the most recently confirmed bar. Using barstate.isconfirmed to restrict logic to confirmed, closed bars is the standard technique for avoiding this issue.
Trading disclaimer: Trading involves risk. This article is for educational purposes only and is not financial advice. Technical analysis tools do not guarantee profitable results. Past performance is not indicative of future results. Always manage your risk appropriately.
