
TradingView Drawing Tools: Best Complete Guide (2026)
Affiliate Disclosure: This article contains affiliate links. If you sign up for TradingView through a link on this page, I may earn a commission at no extra cost to you. I only recommend tools I have genuinely evaluated.
Most traders open TradingView’s drawing tools once, draw a few lines, and end up with a cluttered chart they cannot read. The problem is not the tools — it is not knowing which tool to reach for, when to use it, and how to keep drawings organised so they actually help rather than obscure the price action underneath. A clean chart with three well-placed drawings tells you more than a chart covered in fifty overlapping lines.
Having used professional charting tools across 30 years in finance, I can tell you that drawing discipline is one of the most consistently underestimated charting skills. The traders who make the best use of tradingview drawing tools are not the ones using the most tools — they are the ones who use a small number of tools deliberately and consistently. This guide covers exactly that: which tools matter, how to use them correctly, and how to manage your drawings so your charts stay readable session after session.
If you are not yet using TradingView, the free plan includes full access to every drawing tool covered in this guide. You can start for free at TradingView — no credit card required.
Quick Answer
TradingView drawing tools live in the left toolbar of any chart. The eight categories are: Cursors, Trend Lines, Gann and Fibonacci tools, Patterns, Forecasting and Measurement tools, Geometric Shapes, Annotation tools, and Icons. For most traders, five tools cover 90% of real analytical needs: the horizontal line, the trend line, the rectangle zone, Fibonacci retracement, and the text annotation. Enable magnet mode to snap drawings precisely to OHLC price points, and use the object tree to manage all drawings on a chart from one panel.
Understanding the TradingView Drawing Tools Toolbar
The tradingview drawing tools toolbar runs vertically down the left side of every chart. It is always visible in Supercharts and contains every drawing and annotation tool available on the platform. Understanding how it is organised is the first step to using it efficiently.
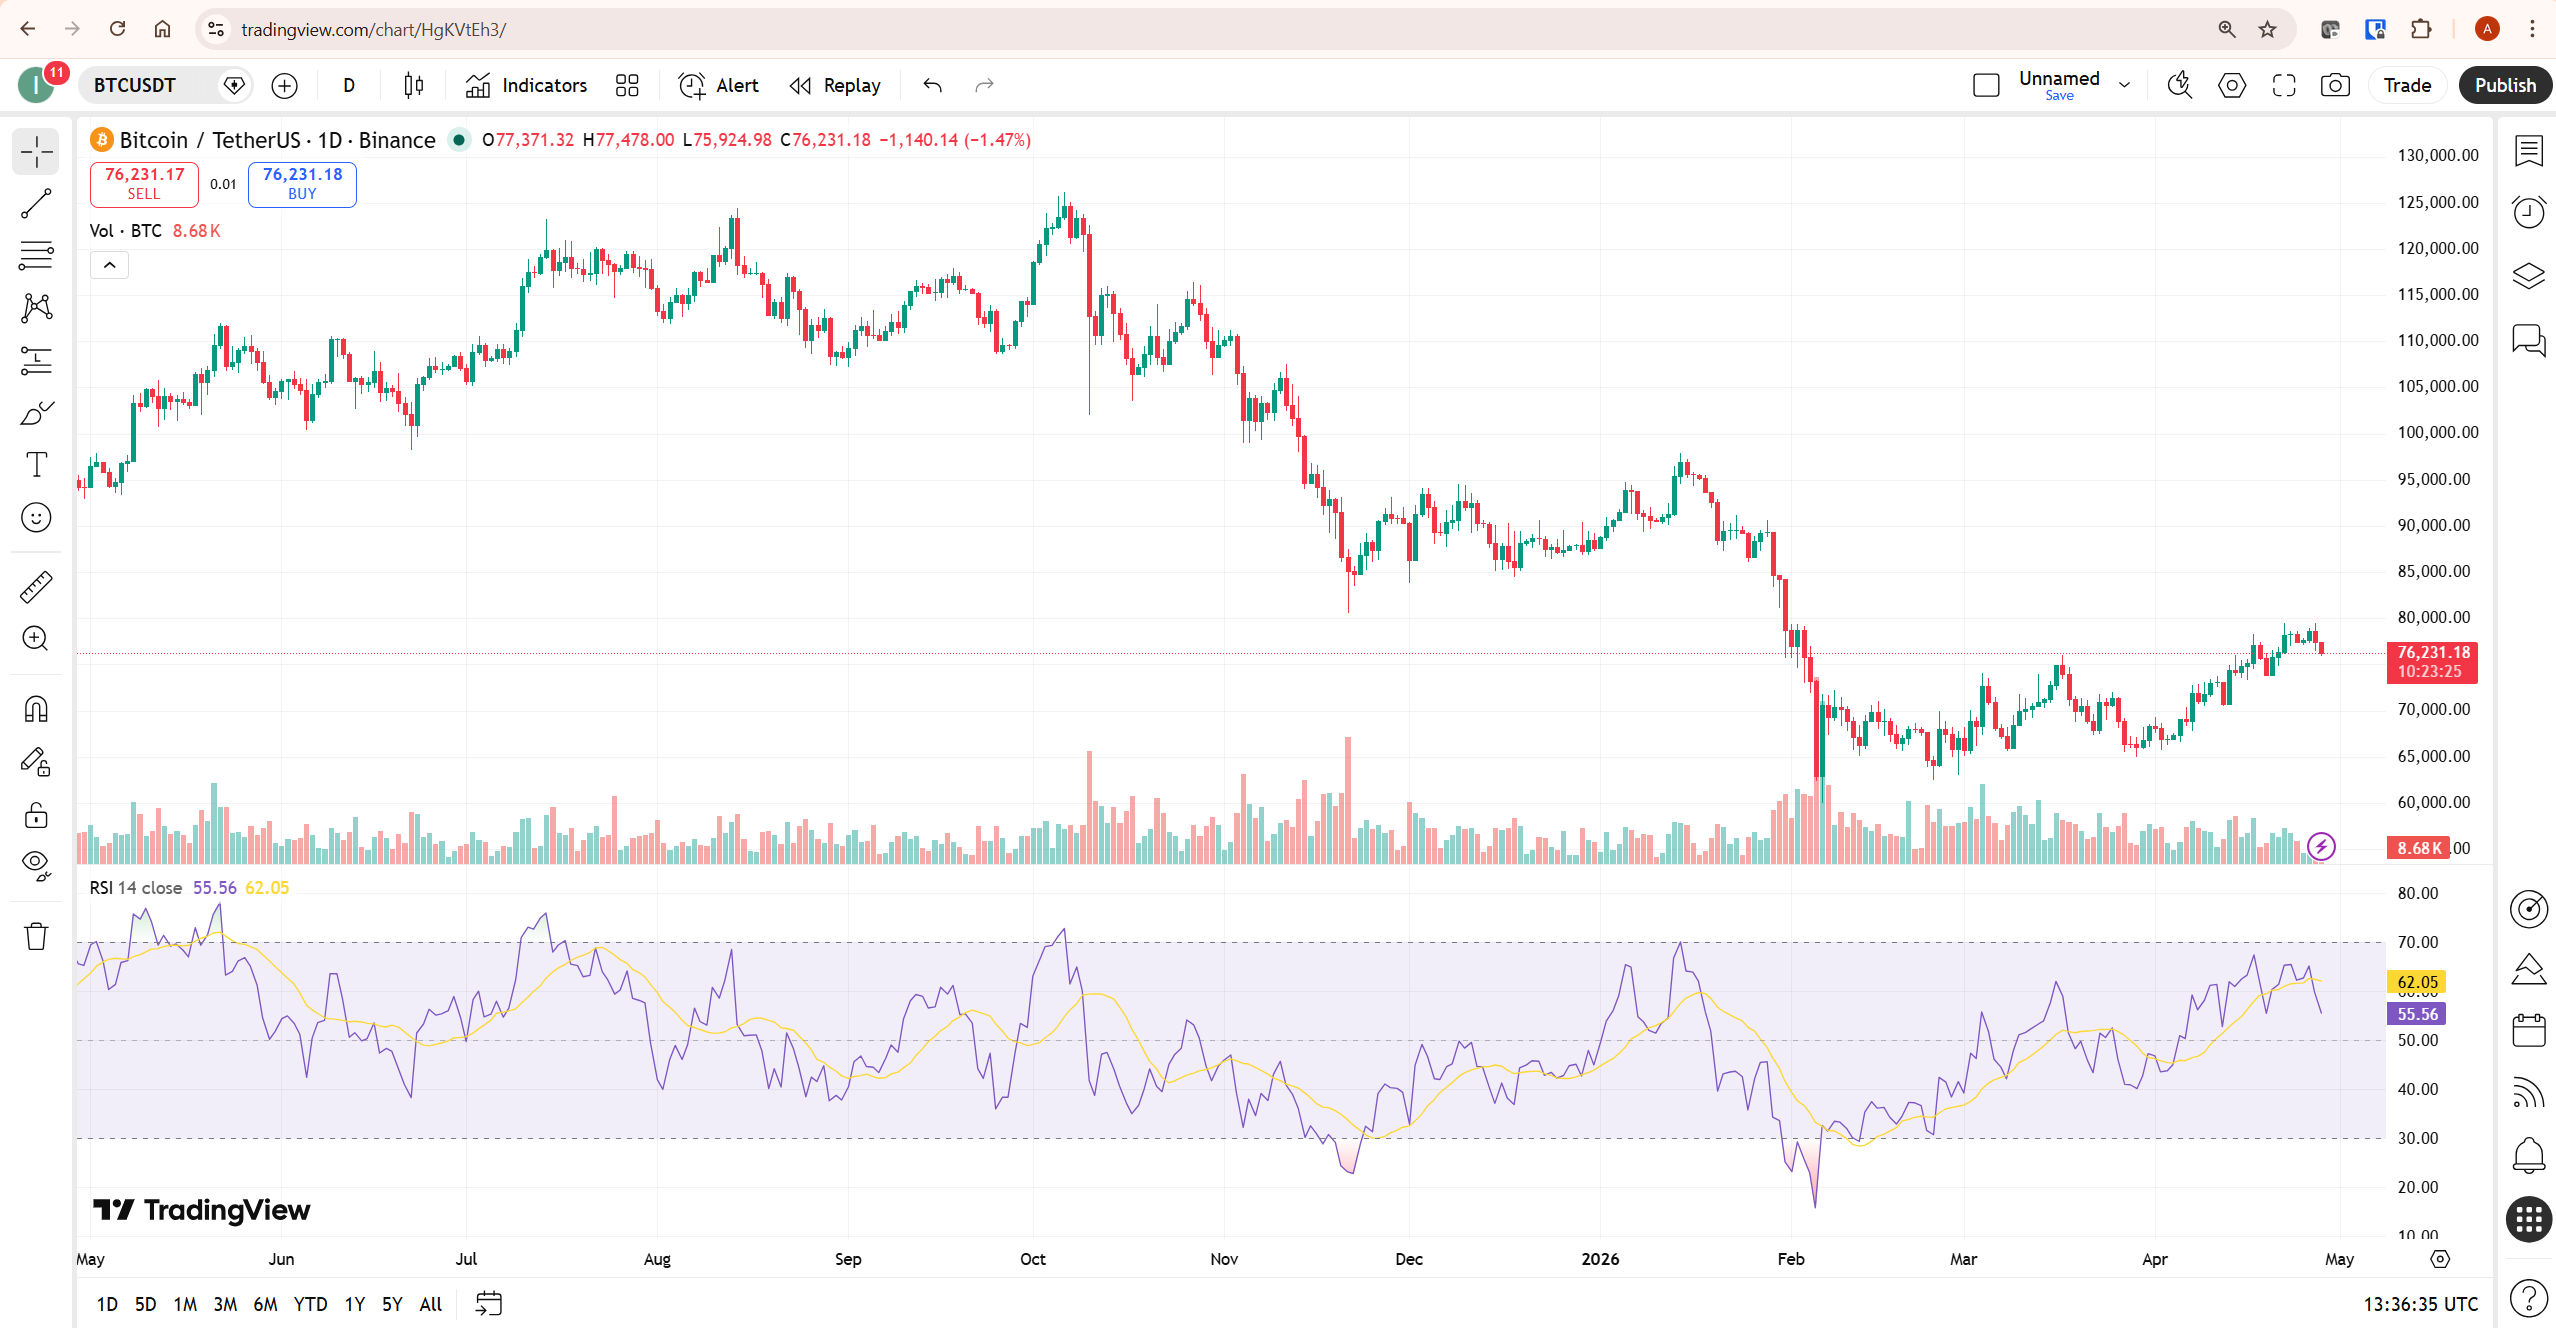
The toolbar is divided into eight categories. Each category icon expands into a submenu when you hover or click on it, revealing the specific tools within that group. The categories from top to bottom are: Cursors (pointer and eraser), Trend Line tools (lines, channels, pitchfork), Gann and Fibonacci tools (retracement, extension, fans), Patterns (Elliott wave, head and shoulders, XABCD), Forecasting and Measurement tools (forecast, price range, date range), Geometric Shapes (rectangle, ellipse, triangle), Annotation tools (text, callout, table), and Icons (emojis and stickers).
Below the eight categories are four utility tools: a zoom tool, a measure tool (ruler), magnet mode, and a stay-in-drawing-mode toggle. These four utilities change how you interact with drawings rather than adding new drawing types — and magnet mode in particular is essential for precise chart work.
The Five TradingView Drawing Tools Every Trader Actually Needs
When using tradingview drawing tools, the five below cover the analytical needs of the vast majority of technical traders. TradingView offers dozens of drawing tools. Most traders need five. This is not a limitation — it is a workflow decision. Every tool you add to your regular rotation is a tool you need to manage, maintain, and interpret.
1. Horizontal Line — Alt + H
The horizontal line is the most used drawing tool on TradingView and the most important one to master. It marks a specific price level — a previous high, a previous low, a psychological level like a round number, or a key support and resistance zone. Unlike a trend line, a horizontal line never needs adjusting as time passes — it remains valid at that price level indefinitely.
To draw a horizontal line, press Alt + H and click anywhere on the chart. The line extends infinitely in both directions across the chart. Right-click the line and select Settings to change its colour, style, and thickness. For key levels, use a thicker line or a brighter colour to distinguish them from secondary levels.
The most common mistake with horizontal lines is treating them as precise levels rather than zones. In practice, price rarely respects an exact number — it reacts within a range around a key level. Use two horizontal lines to define the top and bottom of a zone rather than a single line, and you will find your levels hold up more consistently in real trading conditions.
2. Trend Line — Alt + T
The trend line connects two or more price points to define a directional bias. An uptrend line connects higher lows. A downtrend line connects lower highs. The line then projects forward, showing where price might find support or resistance in the future if the trend continues.
Press Alt + T and click your first point, then click your second point to complete the line. Double-click to finish. TradingView automatically extends the line beyond your two points — you can toggle this off in the line’s Settings under the Style tab if you want the line to end at your second point rather than project forward.
Enable magnet mode before drawing trend lines — it snaps your cursor to the exact high or low of each bar rather than an approximate point, producing much more accurate lines. The keyboard shortcut to toggle magnet mode is the magnet icon in the toolbar below the eight main categories.
3. Rectangle — Support and Resistance Zones
The rectangle tool from the Geometric Shapes category is more useful for most traders than a single horizontal line because it creates a zone rather than a precise level. Draw a rectangle by clicking the top boundary of a support or resistance area, dragging to the bottom boundary, and releasing. The shaded box clearly shows the zone where price has historically reacted.
Zones drawn with rectangles are more realistic than single lines because they acknowledge that market reactions happen across a price range, not at one perfect number. For a demand zone, shade the area between the last significant low and the candle body that preceded the move away from that low. For a supply zone, do the reverse from a significant high. Reduce the rectangle’s opacity in Settings so the price action behind it remains clearly visible.
4. Fibonacci Retracement — Alt + F
Fibonacci retracement is TradingView’s most popular advanced drawing tool — and also the most misused one. The tool draws horizontal levels at key Fibonacci ratios (23.6%, 38.2%, 50%, 61.8%, 78.6%) between a swing high and a swing low, showing where a retracement move might find support or resistance before the trend continues.
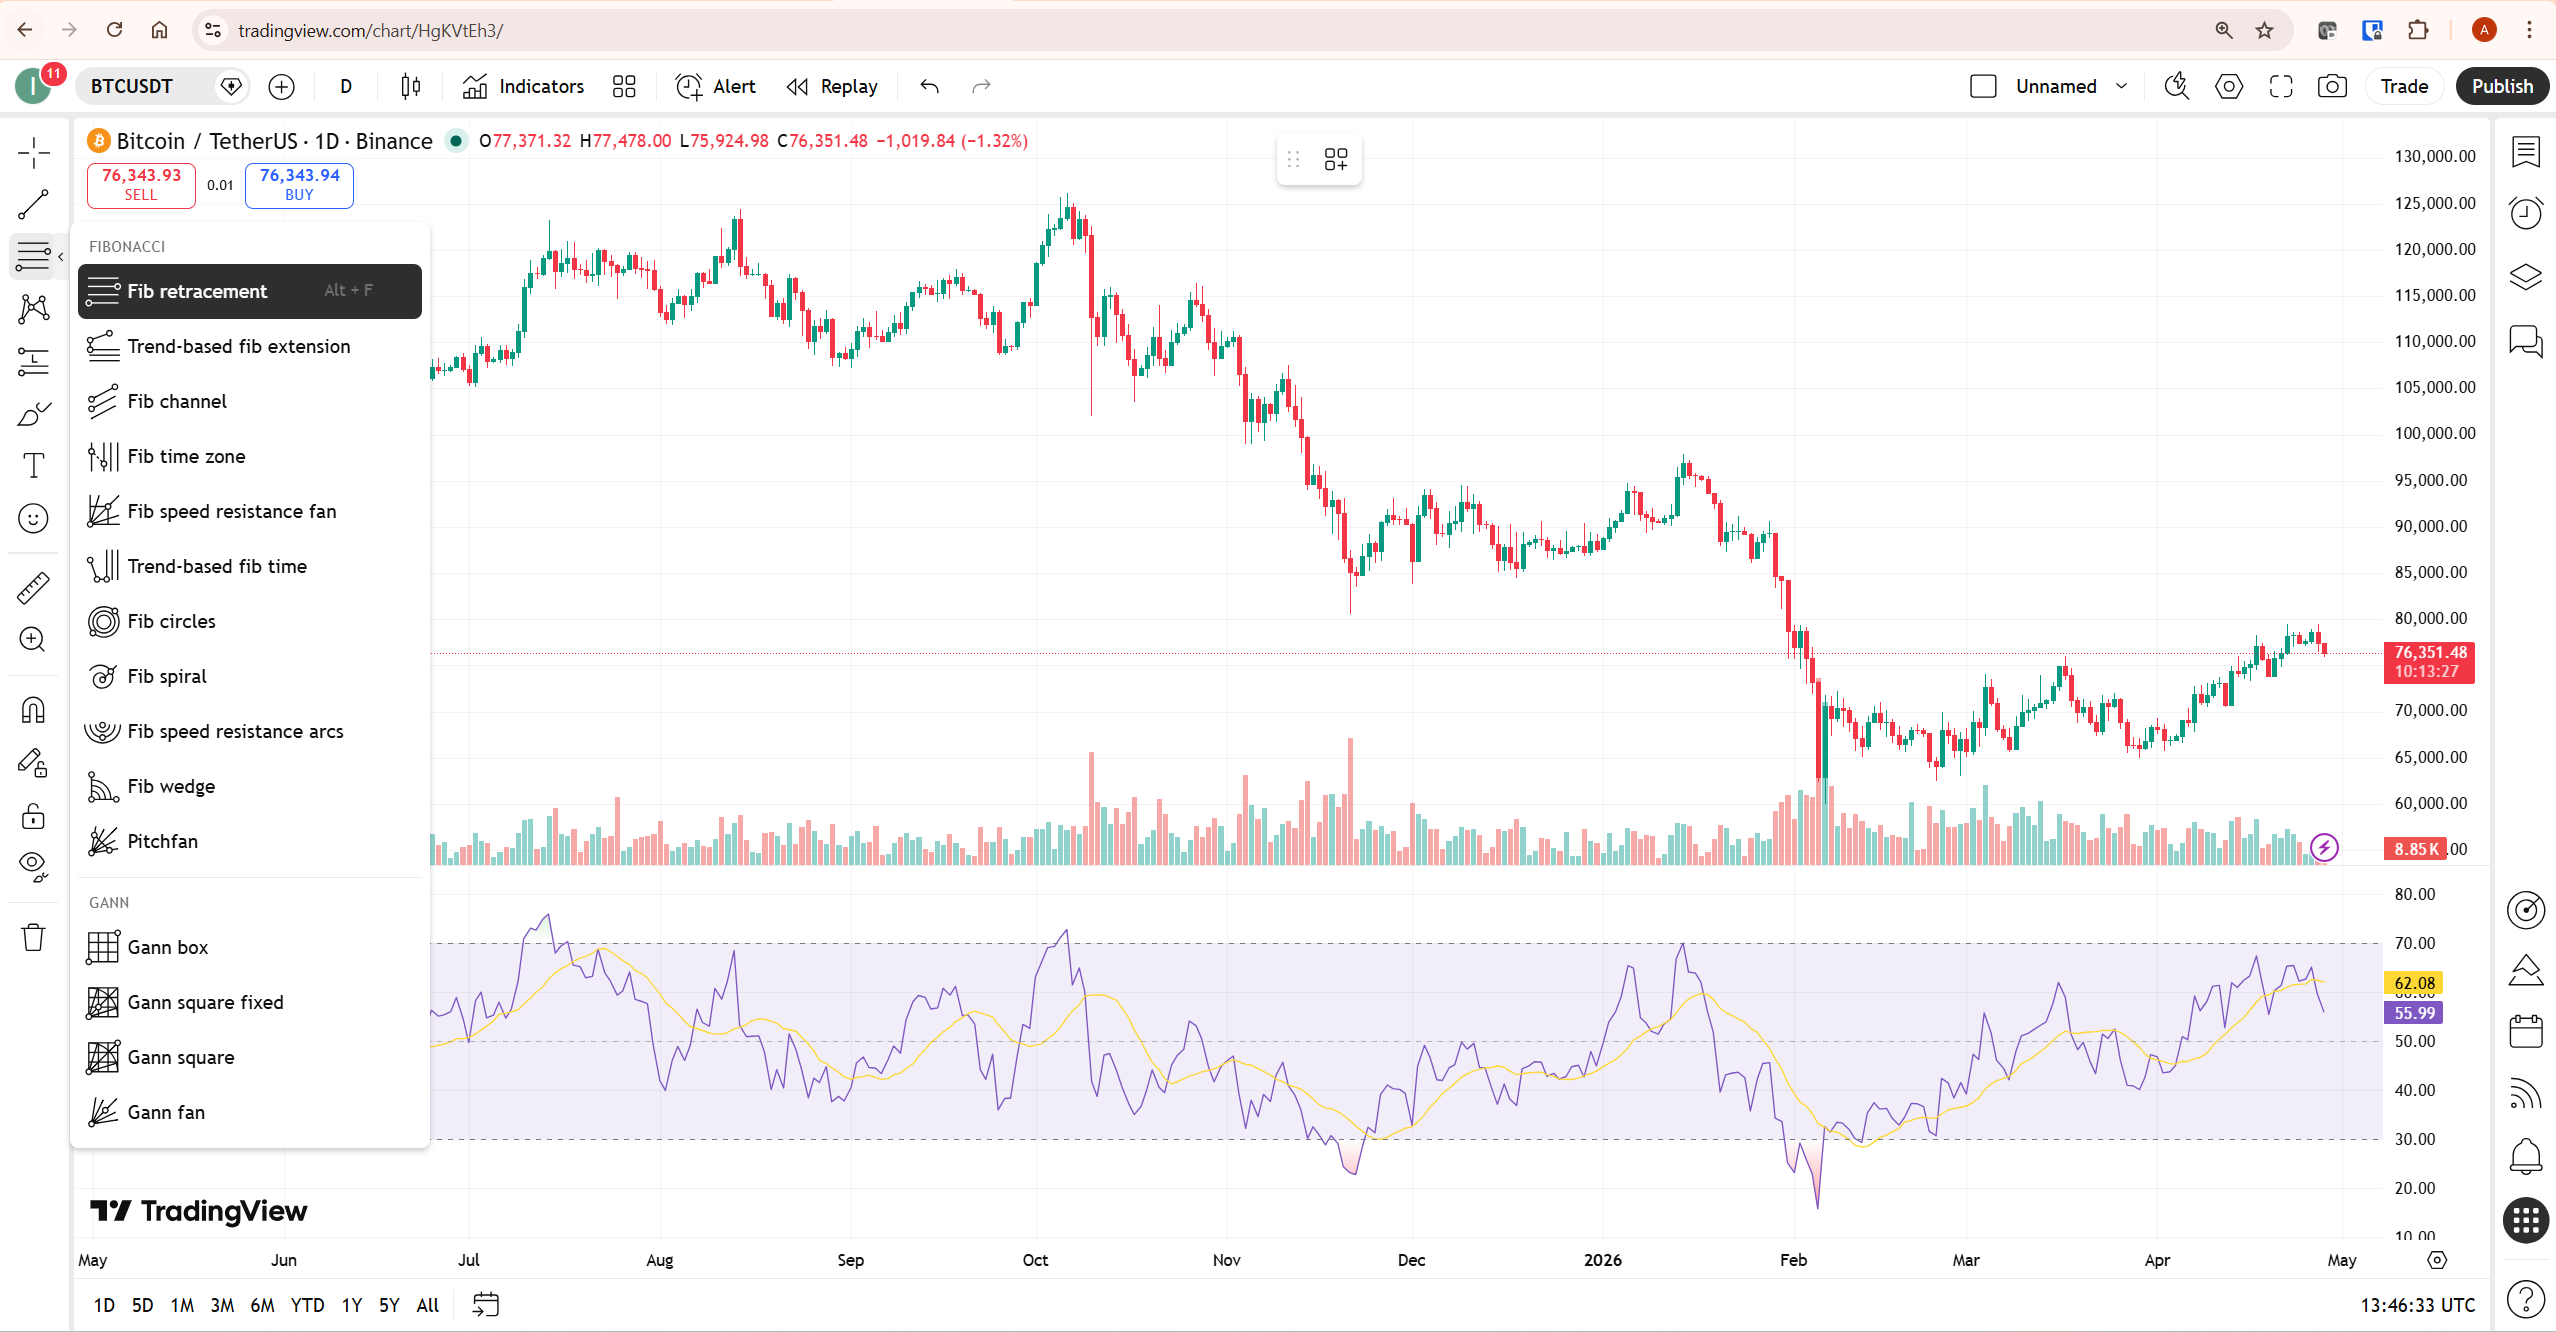
Press Alt + F and click your swing high, then drag to your swing low (for a bullish retracement) or swing low to swing high (for a bearish retracement). The levels appear automatically. The 38.2% and 61.8% levels are the most widely watched — price that retraces to these levels and shows a reaction is often considered a high-probability continuation setup by technical traders.
The critical rule for Fibonacci: always draw from a significant swing point, not from an arbitrary price level. A Fibonacci drawn from a genuine swing high to a genuine swing low has analytical meaning. One drawn from an arbitrary point is noise. Take time to identify the correct anchor points before drawing — the quality of the tool depends entirely on the quality of the anchor points you choose.
5. Text Annotation — Alt + A
Text annotations are underused by most traders and essential for maintaining chart clarity over time. A horizontal line drawn three weeks ago means nothing when you return to the chart if you cannot remember why you drew it. A text label saying “Previous ATH — strong resistance” or “Key demand zone from Nov 2024” transforms a drawing from a visual mark into useful documented analysis.
Press Alt + A to activate the text tool and click anywhere on the chart to place your annotation. Keep annotations brief — three to five words maximum. The goal is a reminder of your reasoning, not a full analysis. Colour-code your annotations to match the drawing they describe — red text for resistance levels, green text for support levels.
How to Draw a Trend Line on a Bitcoin Chart
Drawing a trend line correctly on a crypto chart requires three decisions before you touch the tool: which timeframe to draw on, which swing points to connect, and whether you are defining support or resistance. Getting these decisions right matters more than technical proficiency with the tradingview drawing tools themselves.
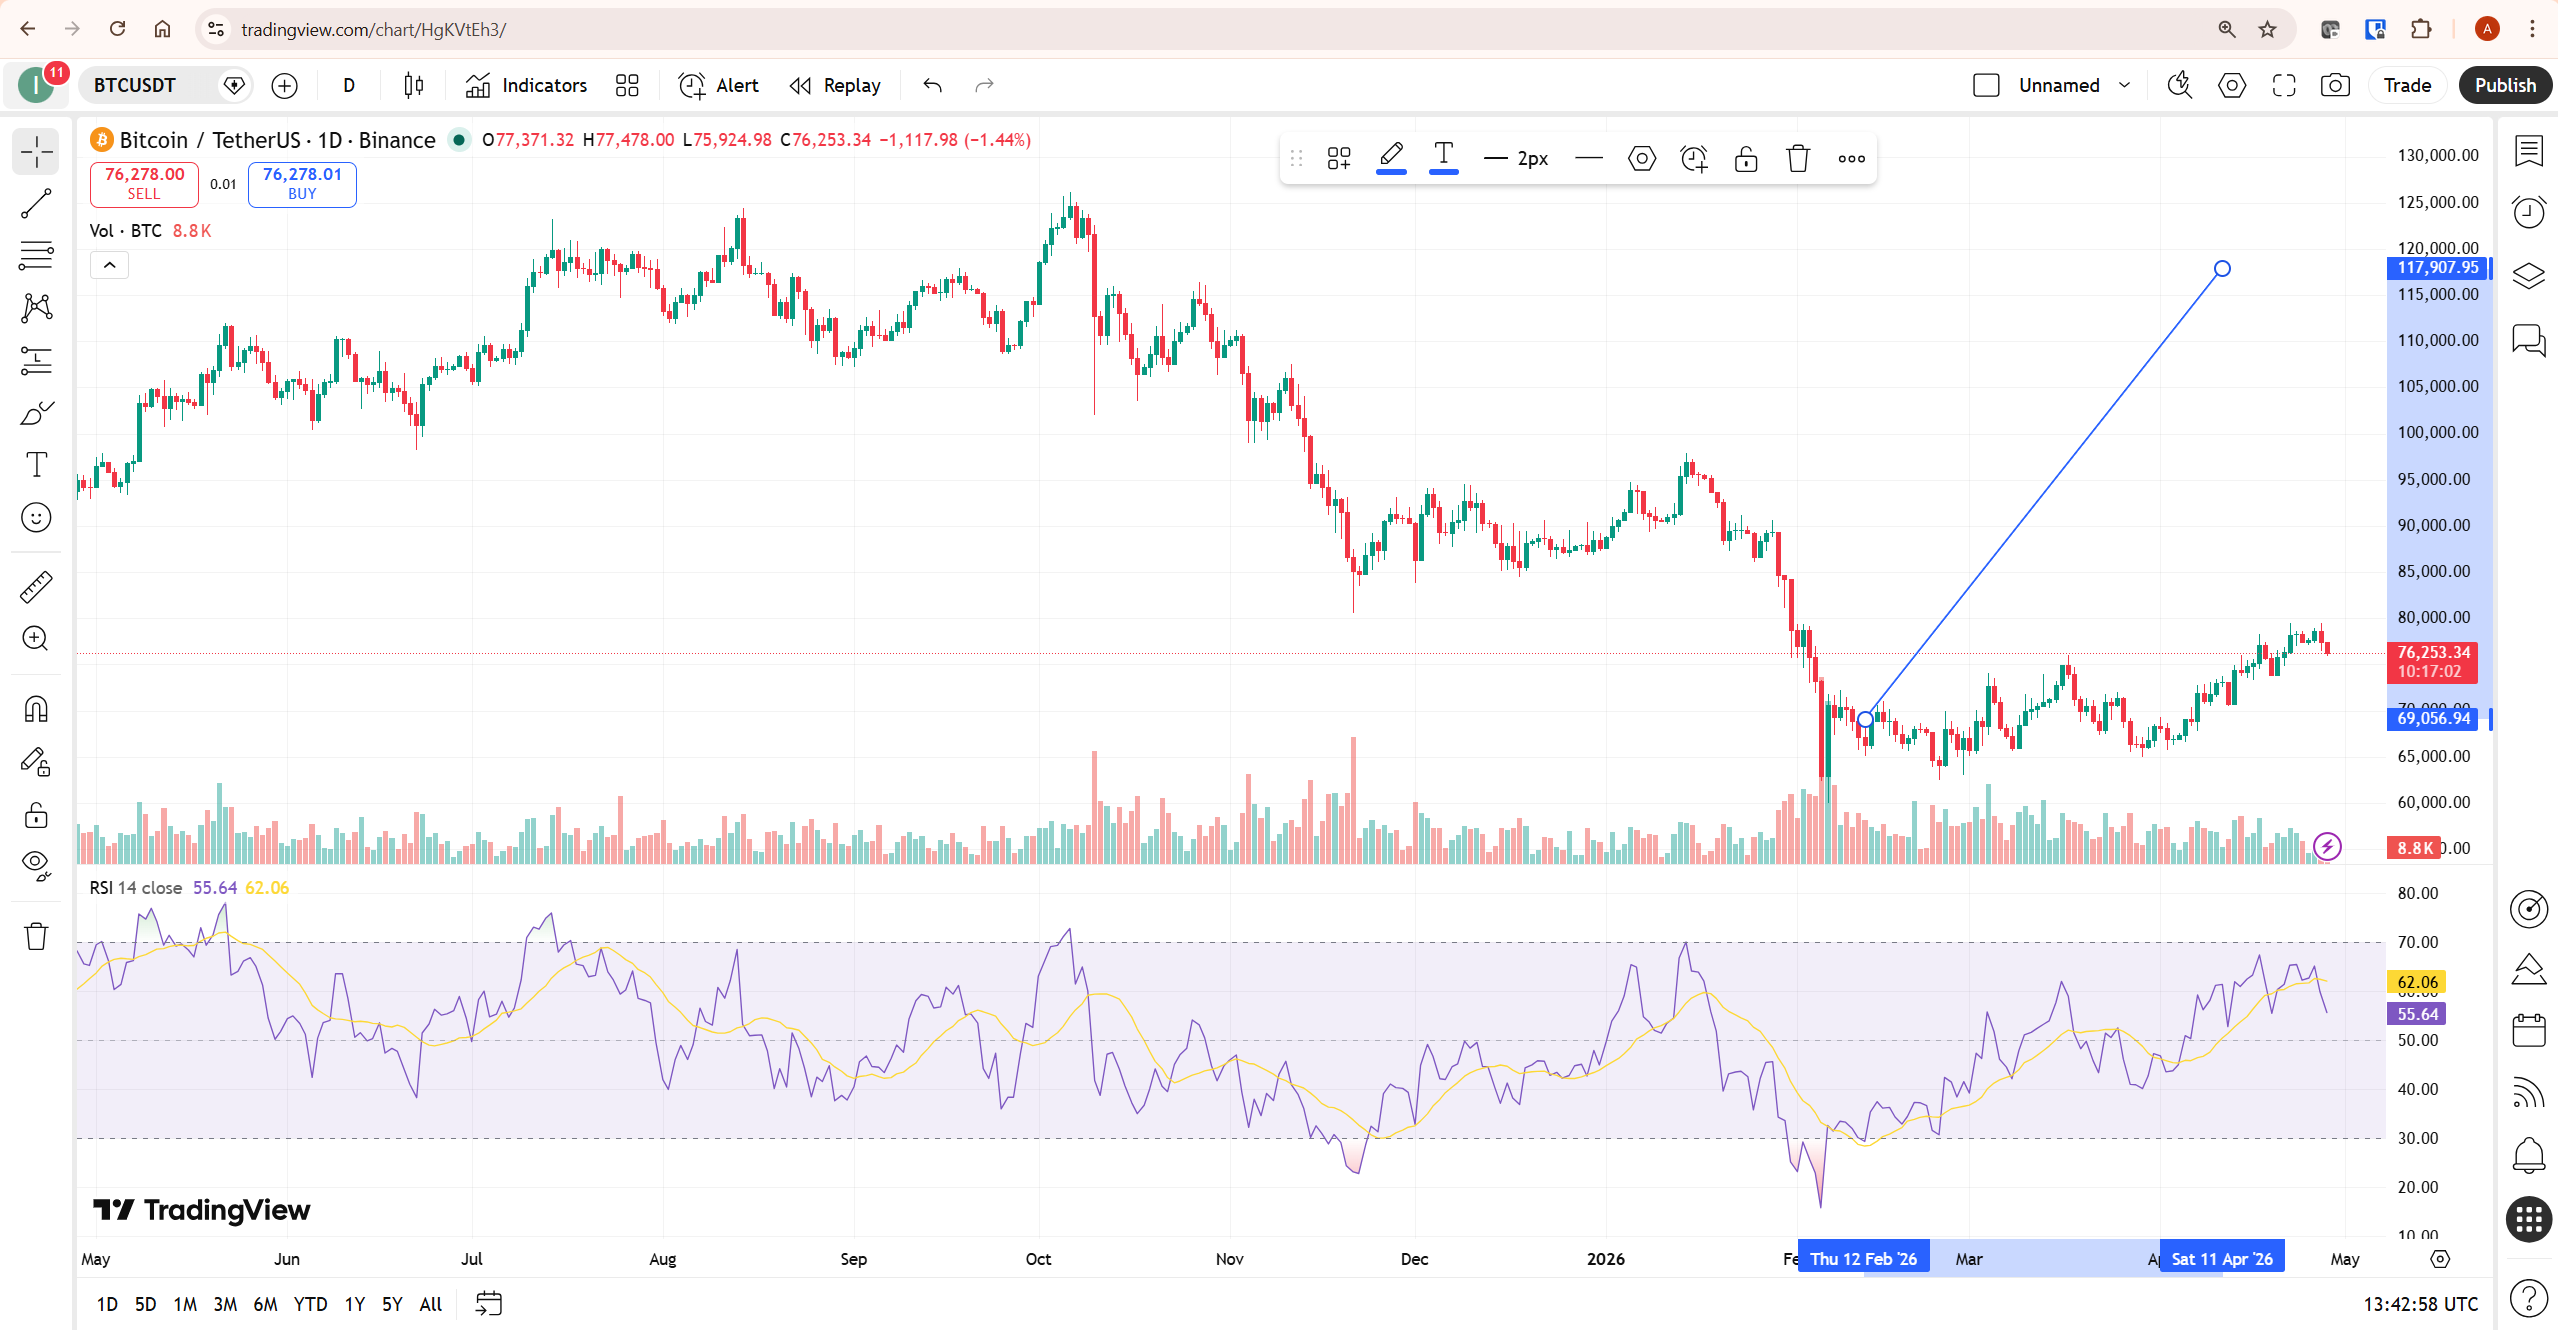
For a daily chart trend line on Bitcoin, follow these steps. First enable magnet mode by clicking the magnet icon below the main toolbar categories. This ensures your line snaps to exact candle wicks rather than approximate price points. Then press Alt + T to activate the trend line tool. Click on your first swing low — the lowest point of a significant price dip. Then click on your second swing low, which should be higher than the first if you are drawing an uptrend line. Double-click to complete the line. TradingView extends the line forward automatically.
The validity of a trend line increases with the number of times price touches it without breaking through. Two touches define the line. Three touches confirm it. Four or more touches make it a significant level worth watching closely. A trend line that has been touched four or more times on a daily chart and then breaks is a meaningful signal — not something to dismiss as random noise.
Magnet Mode: The Feature Most Traders Ignore
Magnet mode is one of the most practically useful features in TradingView’s drawing toolkit and consistently the most overlooked. Without magnet mode, every drawing you place is an approximation — your cursor lands somewhere near the high or low of a bar but rarely exactly on it. With magnet mode enabled, the cursor automatically snaps to the nearest OHLC price point of the bar you are hovering over.
There are two magnet modes: Weak and Strong. Weak magnet snaps to the nearest price point when your cursor is close to a bar’s OHLC values. Strong magnet always snaps to the nearest OHLC value regardless of cursor position. For most tradingview drawing tools work, Weak magnet is the right choice — it gives you precision when you need it without taking control away from you when placing drawings in open chart space.
Enable magnet mode by clicking the magnet icon below the eight main toolbar categories, or by pressing the keyboard shortcut shown next to it in the tooltip. The icon highlights when active. Get into the habit of enabling magnet mode before drawing any trend line or Fibonacci retracement — the precision difference is immediately visible and produces significantly more accurate chart work.
Keyboard Shortcuts for TradingView Drawing Tools
Keyboard shortcuts transform the tradingview drawing tools workflow from a series of toolbar clicks into a fast, fluid process. Once you have memorised the five core shortcuts, you can switch between tools without taking your eyes off the chart.
Alt + H — Horizontal line. The shortcut you will use most often. Mark a key level without touching the toolbar.
Alt + T — Trend line. Activates the trend line tool instantly from wherever you are on the chart.
Alt + F — Fibonacci retracement. Single shortcut to access the most used Fibonacci tool.
Alt + V — Vertical line. Useful for marking specific dates — earnings dates, major news events, cycle highs and lows.
Alt + A — Text annotation. Add a label anywhere on the chart without opening a menu.
Alt + I — Invert chart. Flips the price axis — useful for seeing the chart from the opposite perspective when evaluating bias.
On Mac, replace Alt with the Option key (⌥) for all shortcuts. TradingView displays the keyboard shortcut next to each tool name when you hover over it in the toolbar dropdown menus. According to TradingView’s official drawing tools documentation, the full list of available shortcuts is visible directly in the drawing tool menus.
How to Manage and Organise Your Drawings
Drawing management is where most tradingview drawing tools workflows break down. A chart that accumulates dozens of drawings across weeks of sessions quickly becomes unreadable — lines from old analysis obscure current price action, and it becomes impossible to distinguish what is relevant today from what was relevant three weeks ago.
TradingView’s Object Tree solves this problem. Access it from the right toolbar or via the three-dot menu on any selected drawing. The Object Tree shows every drawing on your current chart in a list, with visibility toggles, lock controls, and delete options for each one. This lets you hide drawings for specific timeframes, lock critical levels so they cannot be accidentally moved, and batch-delete outdated analysis without clicking each drawing individually.
Three habits that keep charts clean. First, delete drawings as soon as their purpose is fulfilled — if a trend line breaks decisively, remove it rather than leaving it as clutter. Second, lock key levels using the lock icon in the drawing settings so they cannot be accidentally moved when you click near them. Third, use consistent colour coding across all your charts — one colour for support, one for resistance, one for trend lines — so you can interpret any chart at a glance without re-reading each drawing individually.
Drawings are saved to your TradingView account automatically and persist across devices. A layout saved on your desktop appears identically on your mobile app and any other browser session. For traders who want to preserve specific chart setups without altering their working chart, use TradingView’s layout system to save named versions — accessible from the layout selector at the top of any chart.
TradingView Drawing Tools and Plan Limits
Every tradingview drawing tools category covered in this guide is available on the free plan. There are no drawing tools locked behind a paid subscription — the horizontal line, trend line, rectangle, Fibonacci retracement, and text annotation all work identically on the free tier as on Premium.
What paid plans unlock is not drawing tool access but context around your drawings. More indicators per chart means more analytical layers alongside your drawings. More charts per layout means you can maintain drawings across multiple timeframes simultaneously. Bar Replay on paid plans lets you replay historical price action with your drawings visible, which is a powerful way to test whether your drawn levels have held up historically before relying on them in live trading.
For a complete breakdown of what each TradingView plan includes beyond drawing tools, our TradingView free vs paid guide covers every tier in detail. If you want to unlock Bar Replay and multi-chart layouts alongside your drawing workflow, you can start a 30-day free trial through our TradingView affiliate link.
Common TradingView Drawing Tools Mistakes to Avoid
The most common tradingview drawing tools mistake is adding too many drawings. A chart covered in horizontal lines at every recent high and low, multiple trend lines from different timeframes, and Fibonacci levels from three separate swings is not more analytical — it is noise. Every level you draw competes for attention with every other level. The best chart setups have three to five key drawings, each placed deliberately and for a specific reason.
The second mistake is not using magnet mode. A trend line that misses a swing low by fifty dollars on a Bitcoin chart is a meaningless line — price will not react to an arbitrary point you clicked near a swing low. Magnet mode ensures your anchor points are exact, which is the difference between a drawing that has analytical value and one that is decorative.
The third mistake is drawing on the wrong timeframe. A trend line drawn on a one-minute chart has no relevance to daily price action. Always draw your key levels on the timeframe that matches your trading or investing horizon. A daily chart trader should draw their levels on the daily chart. A swing trader working on four-hour charts should draw primary levels on the daily and use four-hour charts to refine entries.
The fourth mistake is never deleting old drawings. Every tradingview drawing tools session should leave only drawings with a current reason to be on the chart. If a level was broken and price has moved significantly past it, the level is no longer relevant — delete it. Maintaining a clean chart is an active process, not a passive one.
What to Do Next
Open TradingView right now and clear every drawing from your current chart. Start fresh with your tradingview drawing tools. Enable magnet mode. Draw one horizontal line at the most significant support level you can identify on the daily chart. Draw one trend line connecting the most recent higher lows if the asset is in an uptrend. Add one text annotation explaining why you placed each drawing.
That is your complete chart setup. Resist the urge to add more. Work with those two or three drawings for a full trading session and notice how much easier the chart is to read when it is not cluttered. Then add one more element only when you have a specific analytical reason for it.
Frequently Asked Questions
Are TradingView drawing tools free to use?
Yes — all tradingview drawing tools are available on the free plan with no restrictions. Every tool in the toolbar, including trend lines, Fibonacci retracement, rectangles, and annotations, works identically on the free tier as on any paid plan. Paid plans add context around drawings — more indicators, more chart layouts, Bar Replay — but the drawing tools themselves are fully available at no cost.
How do I delete a drawing on TradingView?
Click on any drawing to select it, then press the Delete key on your keyboard. Alternatively, right-click the drawing and select Remove from the context menu. To delete all drawings on a chart at once, right-click anywhere on the chart and select Remove Drawing Tools. For selective deletion across multiple drawings, use the Object Tree panel which lists every drawing with individual delete controls.
How do I save drawings on TradingView?
Drawings save automatically to your TradingView account and persist across all your devices. If you want to save a specific chart layout with its drawings intact while continuing to work on the chart separately, use the Layout save function at the top of the chart — click the layout name and select Save As to create a named copy. This is useful for preserving historical analysis without overwriting your current working chart.
What is magnet mode on TradingView?
Magnet mode snaps your drawing cursor to the nearest OHLC price point of the bar you are hovering over, ensuring precise placement of trend lines and Fibonacci anchor points. There are two modes — Weak magnet snaps when near a price point, Strong magnet always snaps regardless of cursor position. Enable it using the magnet icon below the main drawing tool categories. Using magnet mode for all trend line and Fibonacci work produces significantly more accurate chart analysis.
What is the best TradingView drawing tool for support and resistance?
The rectangle tool from the Geometric Shapes category is the most effective tool for support and resistance because it creates a zone rather than a single line. Real price reactions happen across a price range, not at one exact number. Draw a rectangle covering the high and low of the area where price has previously stalled or reversed, reduce its opacity so price action remains visible through it, and you have a more realistic and reliable level than any single horizontal line. For our full guide to using TradingView’s screener alongside your drawn levels, see our TradingView screener guide.
Can I use TradingView drawing tools on mobile?
Yes — TradingView’s mobile app for iOS and Android includes drawing tools. The toolbar appears at the bottom of the chart screen on mobile. Most drawing tools are available including trend lines, horizontal lines, Fibonacci retracement, and annotations. Drawings created on desktop sync automatically to mobile and vice versa through your TradingView account. The mobile drawing experience is more limited than desktop for precision work, but sufficient for reviewing and managing existing drawings on the go.
Conclusion
TradingView drawing tools are only as useful as the discipline you bring to using them. The platform gives you dozens of tools — your job is to choose five, learn them properly, and use them consistently. A horizontal line at a key level, a trend line connecting significant swing points, a rectangle zone for support and resistance, a Fibonacci retracement on a significant move, and a text annotation explaining your reasoning — that is a complete charting toolkit for most trading styles.
The technical skills take an afternoon to learn. The discipline of keeping charts clean and drawings purposeful takes longer — but it is what separates traders who use tradingview drawing tools effectively from those who accumulate lines until the chart becomes unreadable.
For a full review of everything TradingView offers beyond drawing tools, our TradingView review covers the complete platform. To understand how drawing tools integrate with your indicator setup, our guide to the best TradingView indicators for crypto shows how drawings and indicators work together in a complete analytical workflow. Ready to upgrade your plan and unlock Bar Replay alongside your drawing workflow? Start your free trial at TradingView today.
Trading involves risk. Technical analysis tools do not guarantee profitable results. Past performance is not indicative of future results. Always manage your risk appropriately.
