
How to Use TradingView Paper Trading: Best Complete Guide (2026)
This article contains affiliate links. If you sign up for TradingView through a link on this page, I may earn a commission at no extra cost to you. I only recommend tools I have genuinely evaluated.
Trading involves risk. Technical analysis tools do not guarantee profitable results. Past performance is not indicative of future results. Always manage your risk appropriately.
If you are trying to learn how to use TradingView Paper Trading, the goal is not just to click Buy or Sell and watch a simulated profit-and-loss number move. Used properly, TradingView’s paper trading simulator helps you practise entries, exits, stop-loss placement, position sizing, and trade review without risking real capital.
The mistake most beginners make is treating the simulator like a game — random entries, oversized positions, no stop losses, no trade journal. That creates false confidence. After 30 years in finance, I have seen traders skip structured simulation entirely and lose capital learning lessons a few weeks of disciplined practice would have taught them for free. This guide shows you how to use the paper trading environment as a structured training tool so your practice builds habits that transfer more safely to live trading.
By the end of this guide you will know exactly how to activate and use TradingView Paper Trading from setup through to a structured practice workflow, with specific recommendations for when you are ready to transition to live capital.
If you do not yet have a TradingView account, paper trading is available on the free plan at the time of writing. Get started with TradingView here.
Quick Answer: How to Use TradingView Paper Trading
To use TradingView Paper Trading: open any chart, click the Trade button in the top right corner, select Paper Trading from the broker selection panel, and the simulated account activates immediately with a default $100,000 virtual balance. From there, use the order panel to place market, limit, or stop orders with stop-loss and take-profit levels exactly as you would with a live broker. The critical practice is applying the same risk rules you would use with real capital, documenting every trade, and reviewing performance data systematically before considering a transition to live trading.
Paper Trading Setup Checklist
Use this checklist when setting up the simulator for the first time:
- Open the chart for the asset you want to practise trading
- Click the Trade button in the top right toolbar
- Select Paper Trading from the broker list
- Confirm the simulated account is connected and showing a balance
- Adjust the account balance to match your intended live account size
- Choose your order type: market, limit, or stop
- Set a stop-loss and take-profit level before placing every trade
- Record the setup, entry, exit, risk amount, and result in a trading journal
What TradingView Paper Trading Is and Why It Matters
TradingView Paper Trading is a built-in simulation broker that runs directly inside the chart interface. Unlike generic demo accounts that require separate platform logins or run on delayed data, the simulator works within the exact same analytical environment you will use for live trading — the same charts, the same indicators, the same alert system, the same drawing tools. The only difference is that the capital is virtual and orders are simulated rather than routed to a real exchange.
This integration matters because it eliminates the workflow gap between practice and live trading. When you eventually transition to a live broker, you will already be familiar with the order interface, position management tools, and performance tracking panels — so the only new variable is real capital psychology, not platform mechanics.
According to Investopedia’s guide on paper trading, simulation trading is most effective when traders apply identical risk management rules to their demo account as they would to live capital — treating virtual losses as if they were real to build genuine discipline. For a complete overview of TradingView’s full feature set beyond paper trading, our TradingView review covers the platform in detail.
Step-by-Step: Activating and Using the Simulator
The activation process takes under two minutes. Here is the exact sequence.
Step 1: Open your chart. Go to TradingView and open any asset chart — Bitcoin, EURUSD, a stock, whatever you intend to practise trading. Select the asset and timeframe you intend to trade with in your live account, not just the most convenient option. Practice on the actual market you will trade.
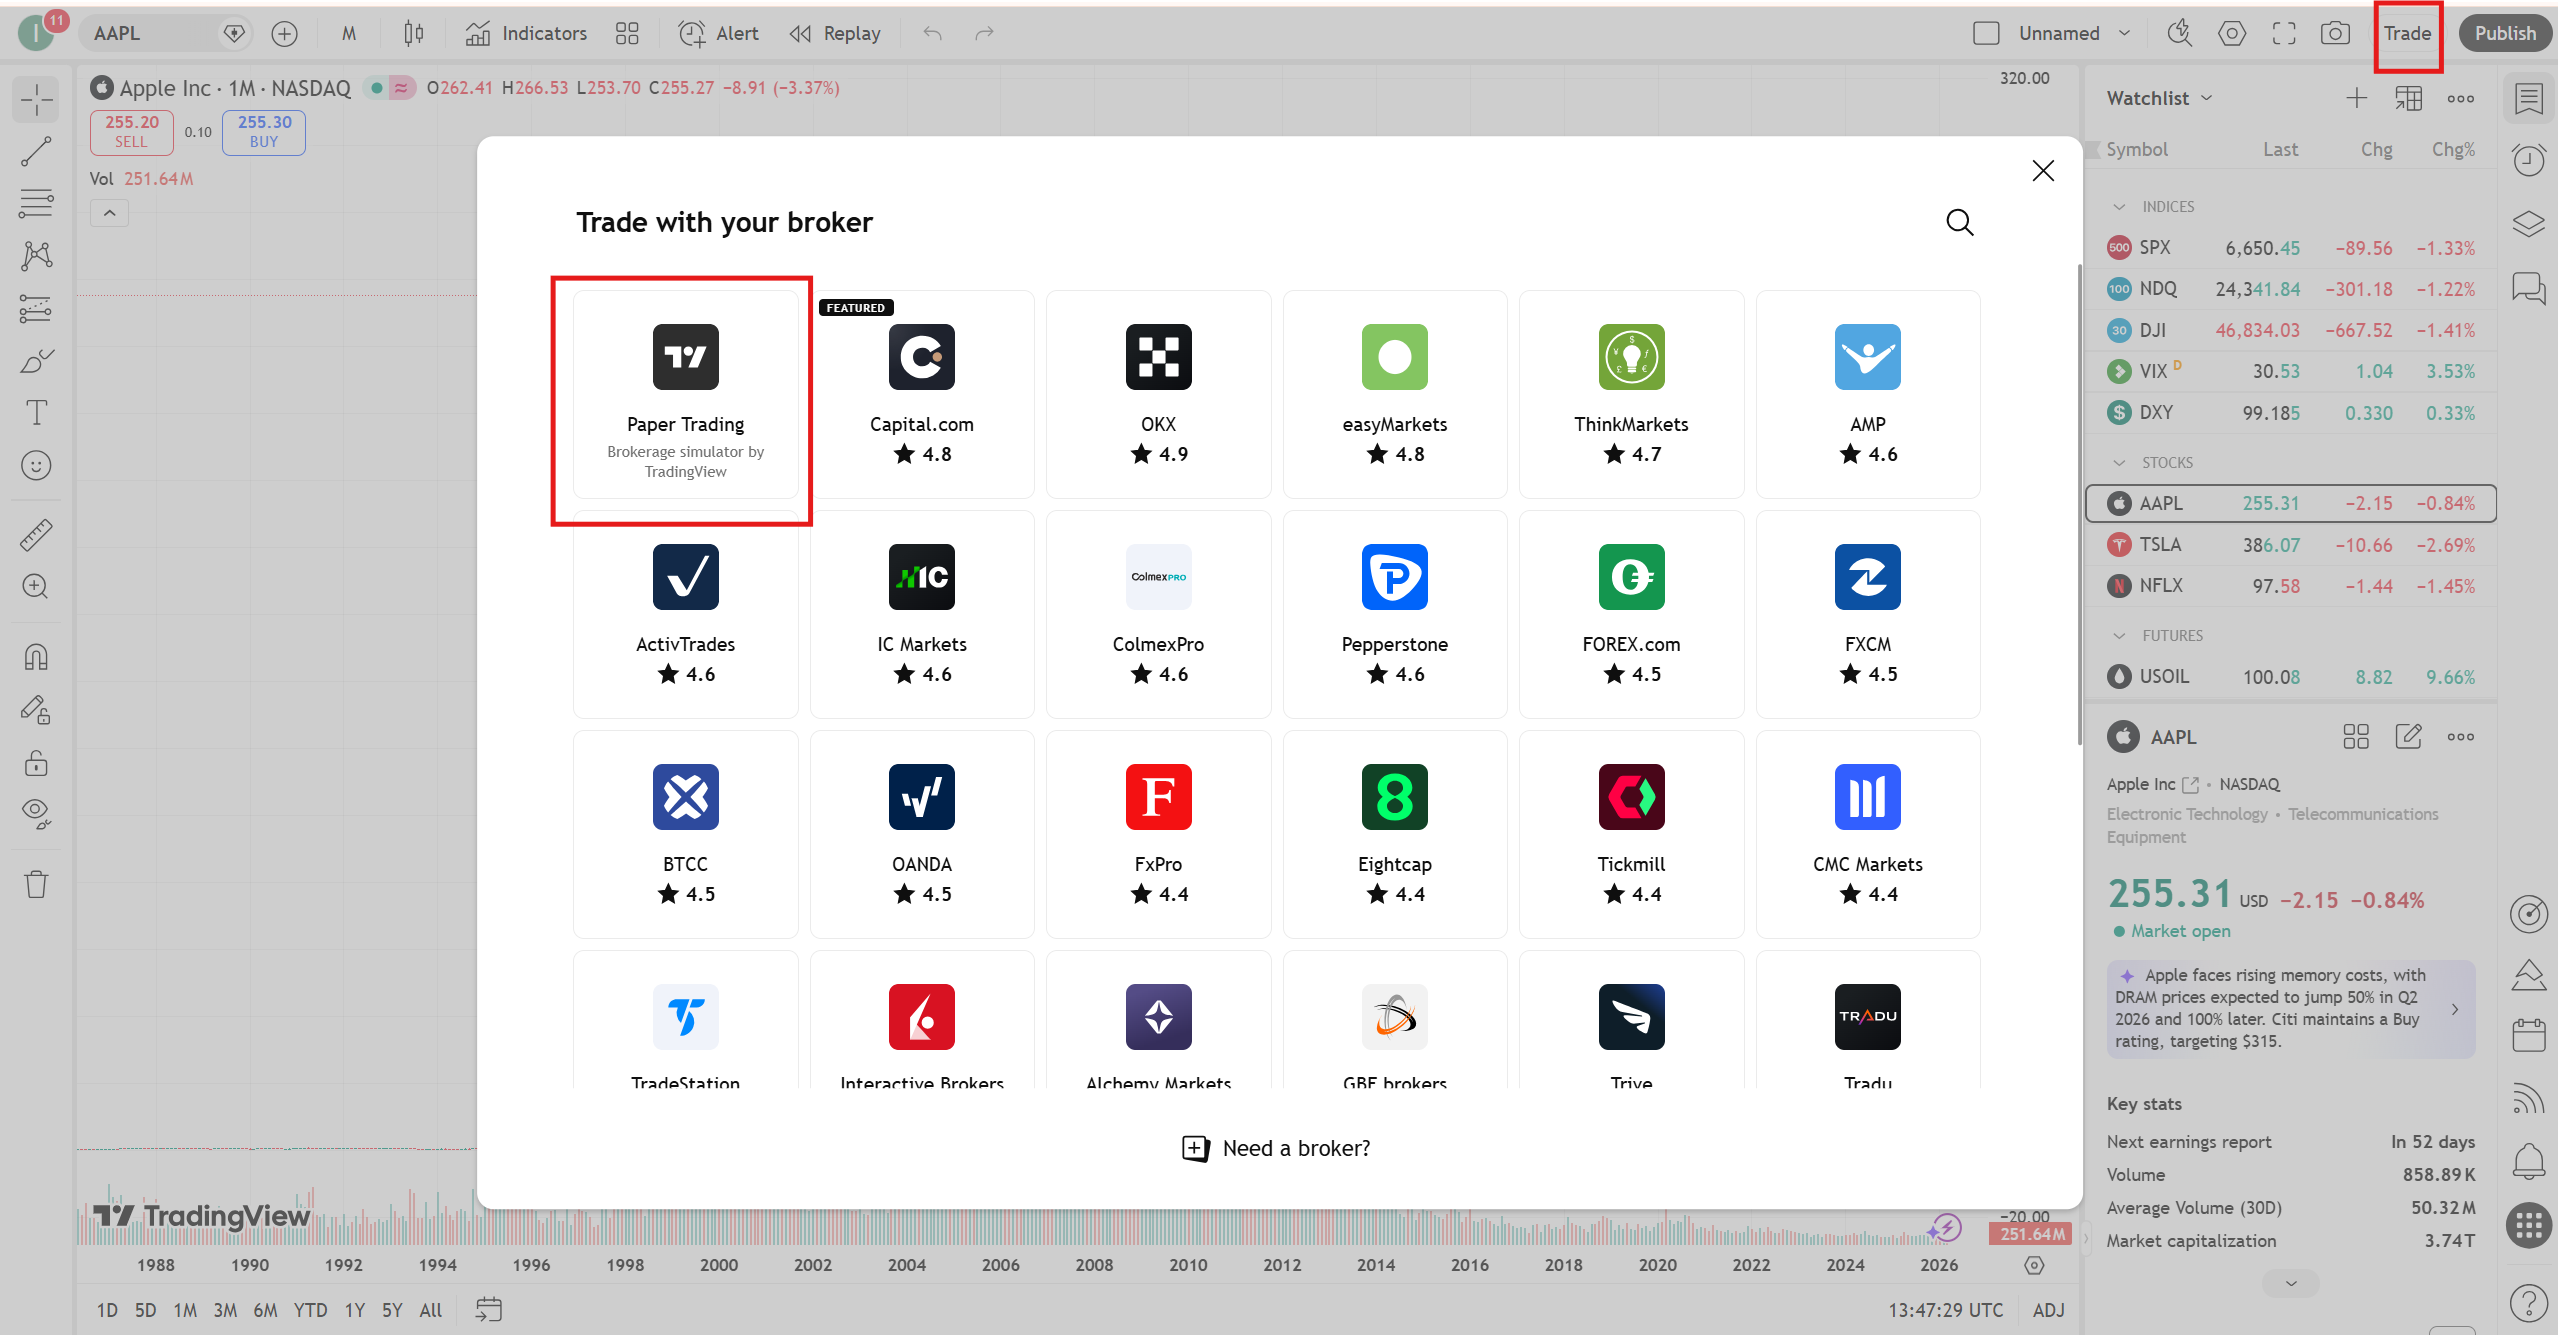
Step 2: Click the Trade button. In the top right corner of the chart toolbar, click the Trade button. This opens the broker selection panel. Scroll through the broker list and select “Paper Trading” — TradingView’s built-in simulation option, which appears at the top of the list.
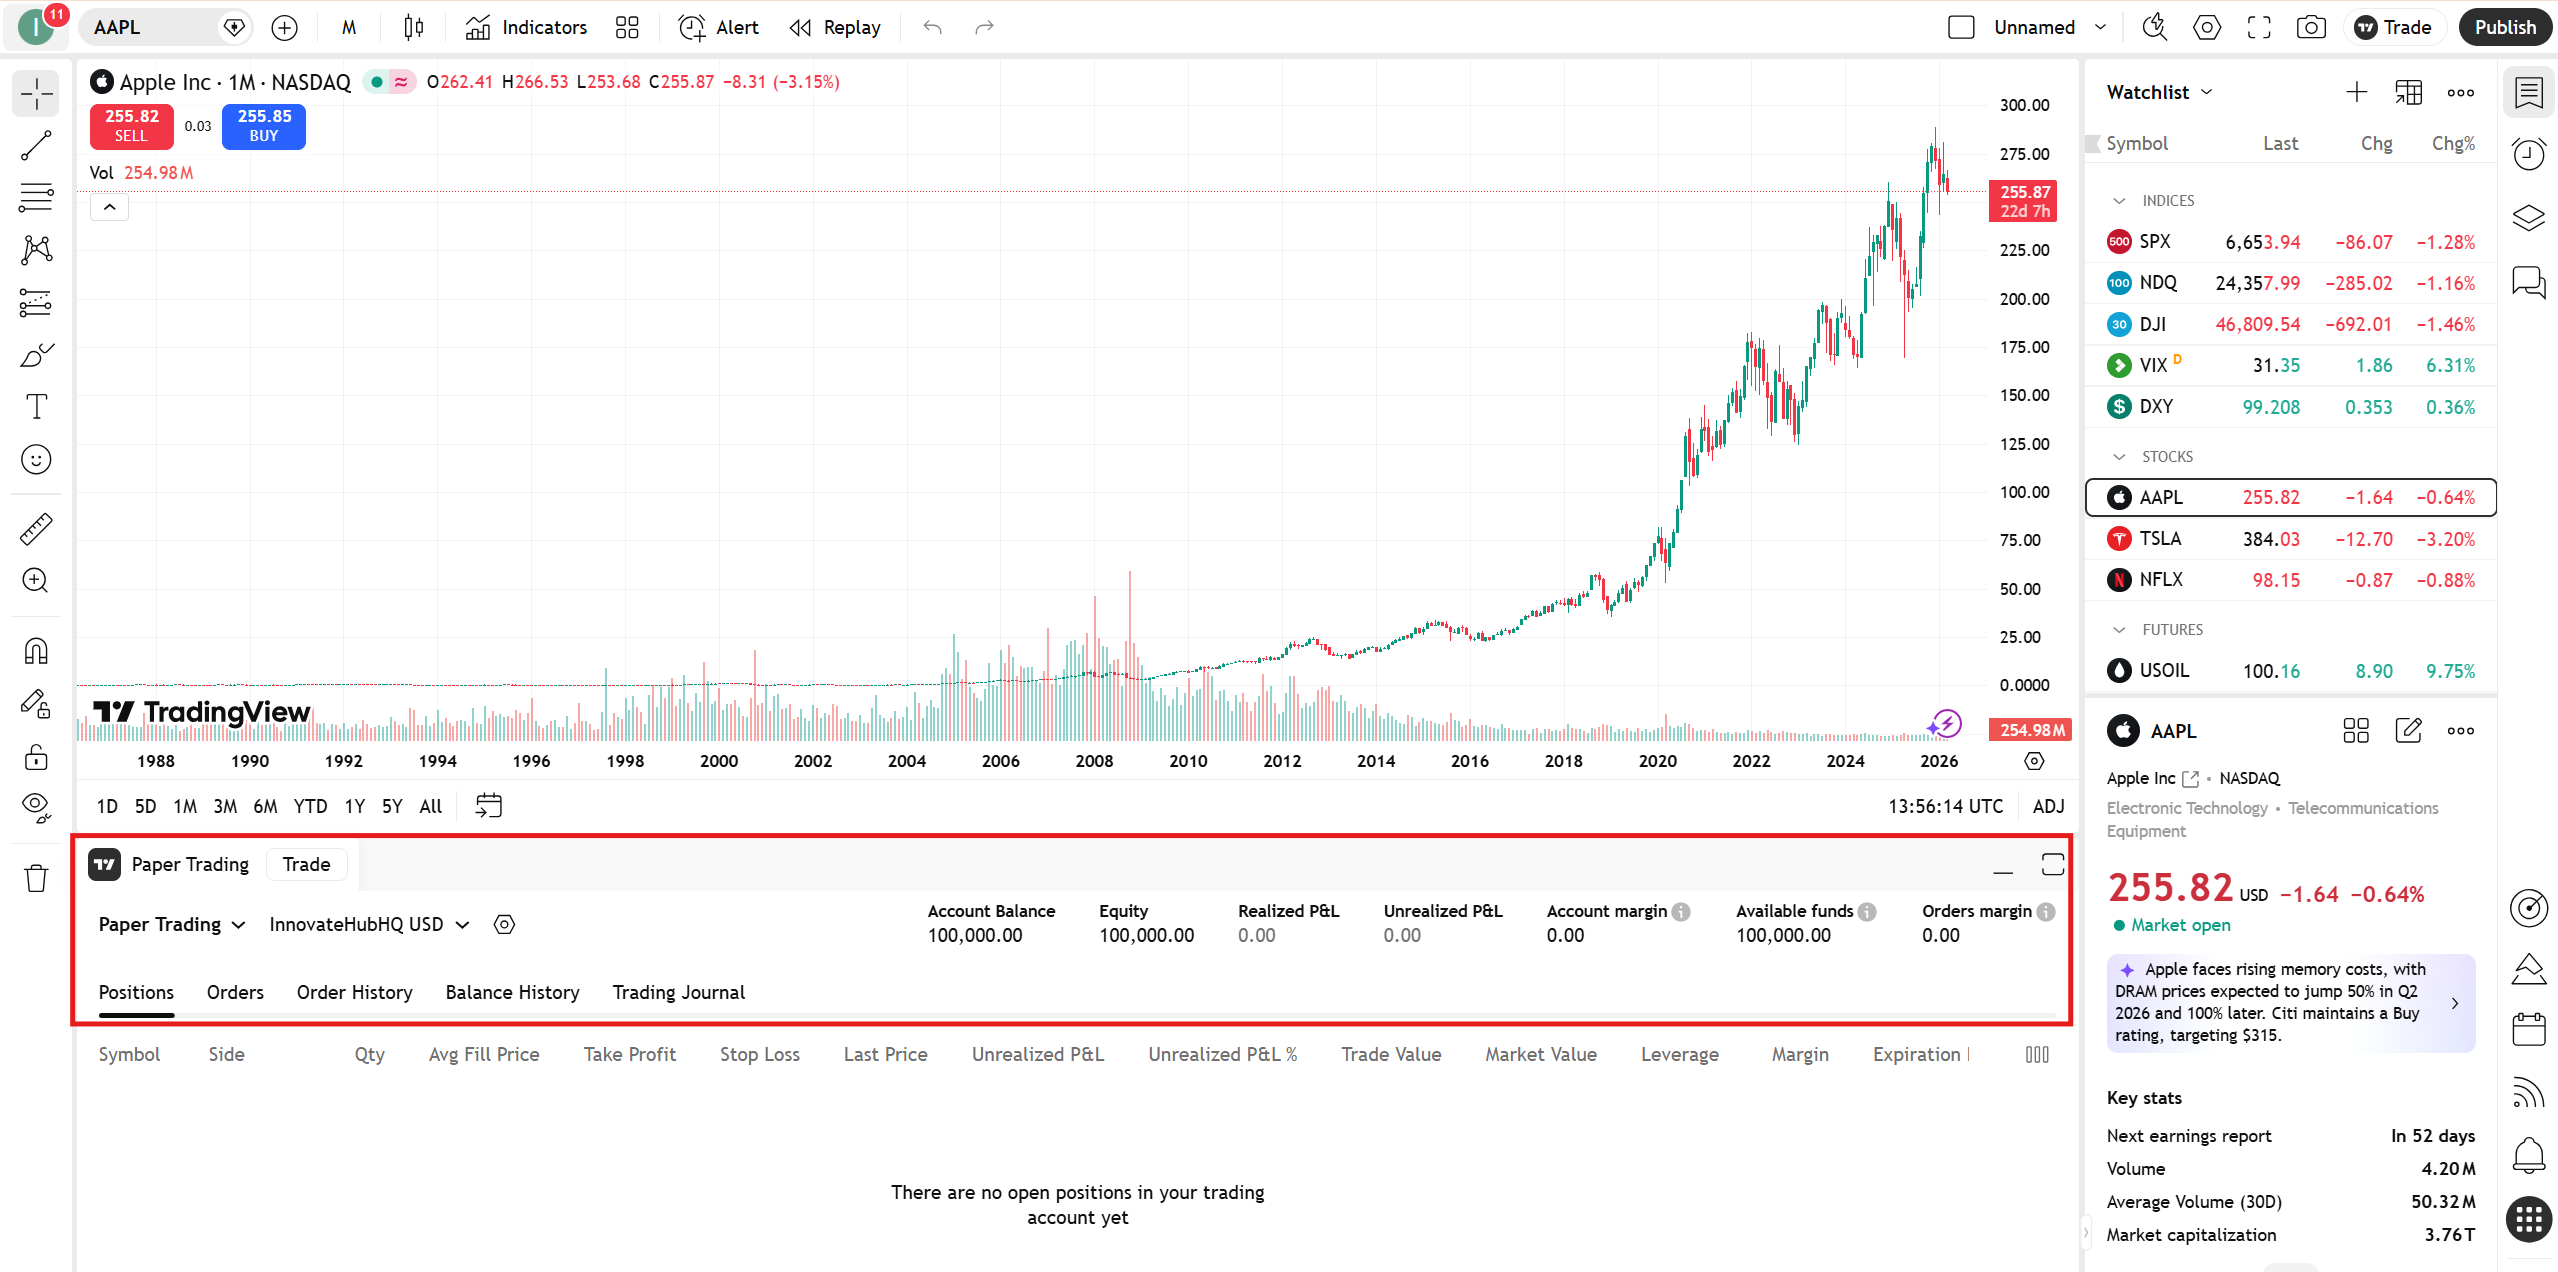
Step 3: Confirm activation. Once you select Paper Trading, the simulation account activates and the panel appears at the bottom of your chart showing your account balance (default $100,000), equity, unrealised P&L, and tabs for Positions, Orders, and Trade History. This is your complete simulation dashboard.
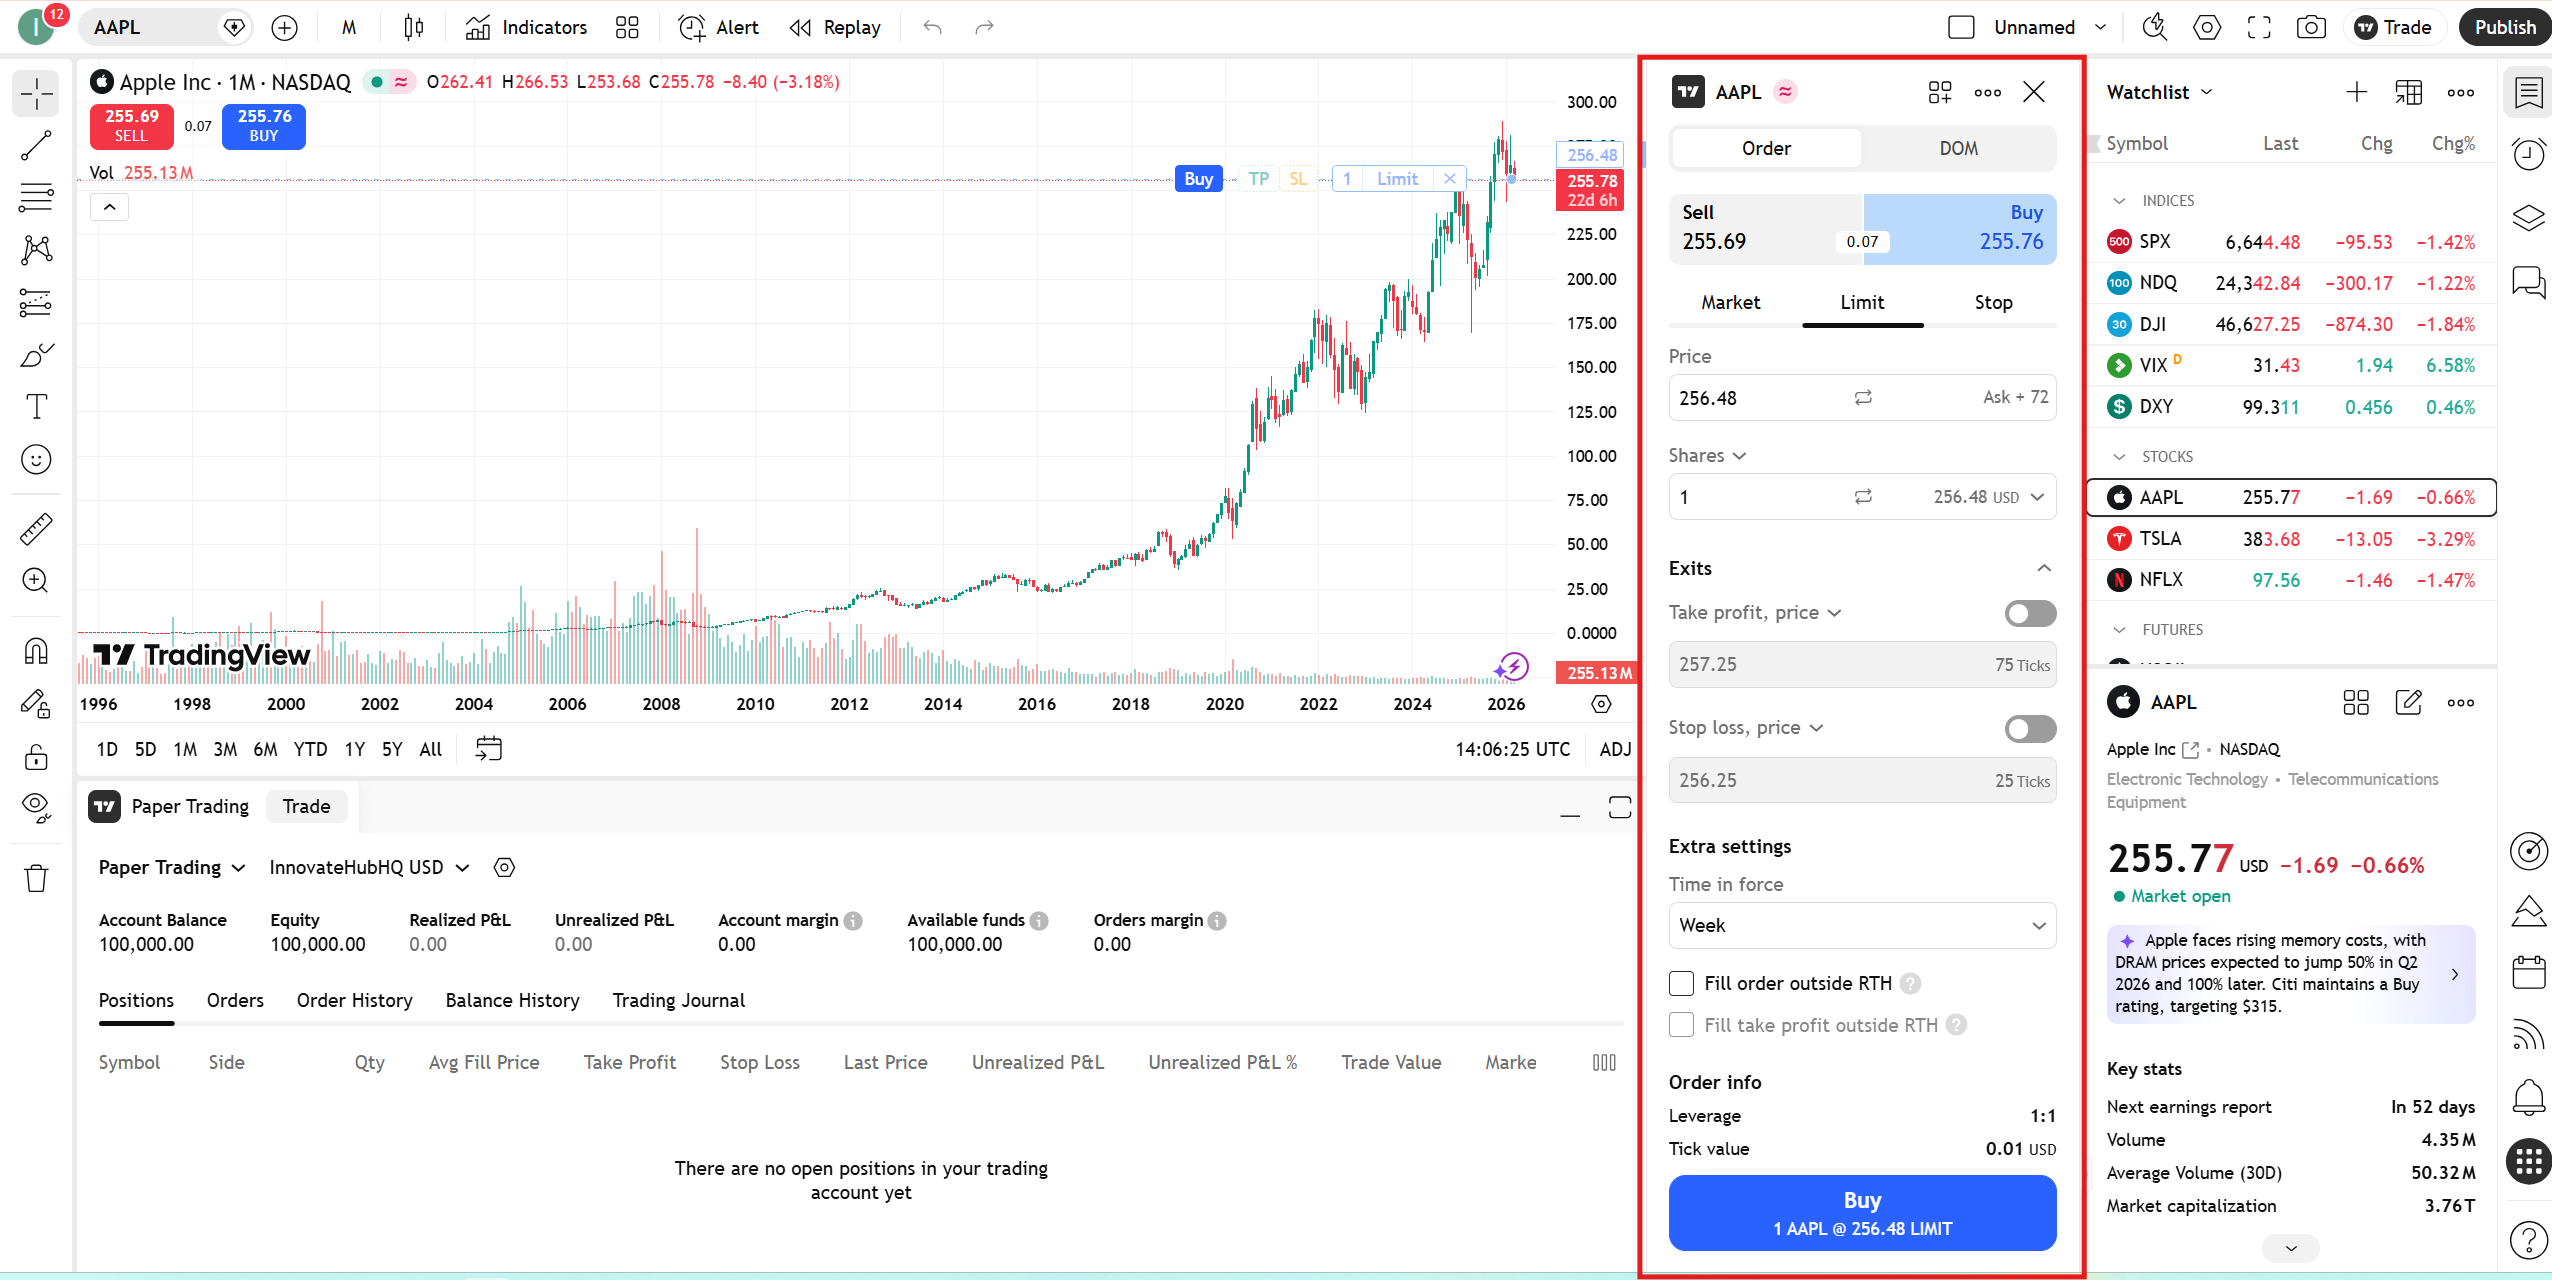
Step 4: Open the order panel. Click the Trade button again to open the order entry panel. Select your order type — Market, Limit, or Stop — enter your position size, set your stop-loss and take-profit levels, and click Buy or Sell. The order executes against live market data in simulation.
Order Types Explained
Practising with the correct order type is one of the most practically valuable things you can learn in simulation — because order type selection has a direct impact on execution quality in live markets.
Market orders execute immediately at the current market price. Best for breakout entries where getting filled at approximately the current price matters more than the exact price. In live markets, market orders carry slippage risk during fast-moving conditions — practising them in simulation builds the instinct for when this order type is appropriate.
Limit orders execute only when price reaches your specified level. Best for pullback entries where you want to buy a specific support level rather than chase price. Learning to set and manage limit orders in the simulator prevents the common mistake of using market orders for every entry regardless of conditions.
Stop orders trigger when price reaches a specified level and then execute at market. Most commonly used as stop-loss protection on open positions or as breakout entry triggers. Practising stop order placement is particularly valuable for traders whose strategy involves breakout confirmation entries.
Risk Management: Where Most Traders Misuse Paper Trading
This is where the difference between useful practice and wasted time is decided — and where most traders get it wrong.
Before placing any simulated trade, define your maximum risk per trade as a percentage of your account — 1% is the standard starting point. On a $100,000 paper account, 1% risk means your stop-loss is positioned so that if it triggers, you lose $1,000 on that trade. Calculate your position size from this risk amount and your stop-loss distance — not from how many shares or contracts look like a reasonable number.
Every paper trade should have a stop-loss and a take-profit set before execution. Trading without these in simulation is how traders develop the habit of holding losing positions indefinitely — a habit that is extremely difficult to break once established with real capital. If you skip stop-losses in paper trading, you will skip them live. The habit forms in simulation, not after you fund your account.
Important: A profitable paper trading record does not prove that a strategy will work with real money. Simulation removes some of the hardest parts of trading — emotional pressure, slippage, hesitation, and the fear of loss. Treat simulated results as training data, not proof of future profitability.
A 30-Trade Practice Plan
The best way to use the simulator is to complete a structured sample of trades before risking real capital. For a beginner, 30 documented trades is enough to reveal basic problems in execution, risk control, and discipline without creating unnecessary complexity.
| Stage | Trades | Main Goal | What to Track |
|---|---|---|---|
| Stage 1 | Trades 1–10 | Learn order entry and platform mechanics | Order type, entry accuracy, stop-loss placement |
| Stage 2 | Trades 11–20 | Apply consistent risk rules | Risk per trade, position size, rule violations |
| Stage 3 | Trades 21–30 | Evaluate whether the strategy is repeatable | Win rate, average win/loss, setup quality, discipline |
After completing all 30 trades, review your journal. If your average win is larger than your average loss and your rule adherence is consistent, you are building the foundation for live trading. If losses are larger than wins or stop-losses are being skipped, those are the problems to fix in simulation — not in a live account.
A Structured Session Workflow
Random paper trading produces random results. Building transferable skills requires a structured session workflow — not just opening charts and clicking buttons.
Step 1 — Pre-session analysis. Before opening the order panel, complete your full chart analysis. Check the daily chart for trend context, the 4H for structure and key levels, and your entry timeframe for the specific setup. The analysis comes before the trade — not the other way around. For multi-timeframe analysis workflows, our multi-chart TradingView guide covers the layout configurations that make this most efficient.
Step 2 — Define the trade before entering. Write down the setup criteria, entry price, stop-loss level, take-profit target, and risk amount before clicking Buy or Sell. Pre-defined trade criteria trains the analytical discipline that separates structured traders from reactive ones.
Step 3 — Execute and manage. Place the order with stop-loss and take-profit set. Monitor the position according to your management rules — do not move stop-losses to avoid losses, and do not close winning trades early out of impatience. Position management practice is one of the simulator’s most underutilised applications.
Step 4 — Post-trade review. After each trade closes, review what happened against what you expected. Was the analysis correct? Was the entry well-timed? Did the stop-loss placement make sense given the market structure? Genuine skill development requires this review loop — without it, you are practising execution but not improving analysis.
Tracking Performance Inside the Platform
The Paper Trading panel shows your running P&L, trade history, and position data. Review these regularly — not to check whether you are up or down, but to identify patterns. Are your losses larger than your wins on average? Are you closing winning trades too early and letting losers run? These patterns are exactly what the simulator is designed to surface before they cost real money.
Keep a separate trading journal — a simple spreadsheet works — recording entry reason, exit reason, risk amount, result, and notes on execution quality. A journal transforms 30 trades into a data set with genuine insight into your strategy’s strengths and weaknesses. Without one, you have 30 trades and a P&L number — which tells you almost nothing about what to improve.
Common Mistakes That Waste Paper Trading Time
These are the patterns that prevent traders from getting genuine value from simulation.
Overtrading because the money is not real. Apply a maximum trades-per-day limit in simulation, just as you would live. Overtrading in paper mode trains overtrading live — the habit does not disappear when you fund a real account.
Skipping stop-losses. The single most common and most damaging mistake. Trading without stop-losses on every paper trade is how traders develop the habit of holding losing positions indefinitely — a habit that is extremely difficult to break once established with real capital.
Using unrealistic position sizes. If you plan to start live trading with $5,000, practise on a $5,000 simulated account — not the default $100,000. The position sizing mathematics need to match your real-world situation.
Transitioning to live trading too quickly. A profitable week in paper trading is not sufficient evidence that a strategy works. Complete at least 30-50 trades across different market conditions over at least four weeks before drawing conclusions about strategy viability.
Limitations: What the Simulator Cannot Replicate
Using the simulator with accurate expectations requires understanding what it cannot model.
Market orders in paper trading fill at exactly the current price without slippage. In live markets, fast-moving conditions mean your actual fill price may differ from the quoted price at the moment you clicked. Simulation performance will generally be slightly better than live performance for strategies that use market orders frequently.
Emotional pressure is the largest gap. The simulator cannot fully prepare you for the psychological experience of watching a real stop-loss approach — the temptation to move it, the anxiety of an open position, the impulse to exit early. The goal of paper trading is to eliminate mechanical and analytical errors so that when you go live, psychology is the only remaining challenge rather than one of several simultaneous problems.
According to BabyPips’s guide on demo trading, the most effective approach is to treat each demo trade as if real money were at stake — applying identical emotional discipline, position sizing, and risk rules to paper trades as to live trades.
When to Transition from Paper Trading to Live Capital
Clear transition criteria — not just a feeling that you are “ready” — is what separates traders who transition successfully from those who go live too soon.
This is educational guidance only, not financial advice. Your personal financial situation, risk tolerance, and trading experience should determine whether live trading is appropriate for you.
The minimum criteria for considering a live transition: at least 30-50 completed paper trades with documented entry and exit reasons, positive expectancy over the sample (average win size multiplied by win rate exceeds average loss size multiplied by loss rate), consistent application of stop-loss and take-profit on every trade, and at least four consecutive weeks of disciplined position sizing without rule violations.
When you do transition, start with a live account size and position size significantly smaller than your paper trading account. Treat the psychological challenge as the new variable to learn — not a new set of platform mechanics, strategies, and risk rules simultaneously.
What To Do Next
Do this today — it takes under 10 minutes to get the simulator running correctly:
Open TradingView and navigate to your primary trading asset. Click the Trade button, select Paper Trading, and confirm the account is active. Adjust the simulated balance to match your intended live account size. Place your first trade — with a stop-loss and take-profit set before you click Buy or Sell. Document the setup, entry price, stop-loss level, and risk amount in a journal before moving on.
Repeat that process for 30 trades. Review the journal at trade 30. That review will tell you more about your trading readiness than any amount of chart watching.
For the complete TradingView workflow beyond paper trading — alerts, multi-chart analysis, indicator configuration, and Bar Replay for historical practice — our TradingView review covers everything the platform offers. For the Bar Replay feature that pairs perfectly with paper trading for historical scenario practice, our TradingView Bar Replay guide covers the full setup.
→ Start with TradingView’s free plan and practise with Paper Trading before risking real capital
Related TradingView Guides
- TradingView Review: Is It Worth It for Crypto Traders?
- TradingView Free vs Paid: Which Plan Do You Actually Need?
- TradingView Alerts Explained: Complete Setup Guide
- How to Use TradingView Bar Replay
- How to Use Multiple Charts in TradingView
- Best TradingView Indicators for Crypto Trading
Frequently Asked Questions
Is TradingView Paper Trading free?
Yes — the paper trading simulator is available on the free plan at no cost. It is fully functional without a paid subscription. Paid plans add features that enhance the surrounding analysis environment — multi-chart layouts, more indicators per chart, expanded alerts — but the core simulation functionality itself is available to all users. Get started with TradingView’s free plan here.
Can I reset my TradingView Paper Trading account?
Yes — you can reset your virtual account balance at any time. Go to the Paper Trading panel at the bottom of the chart, click the settings icon, and select Reset Account. This returns the balance to $100,000 and clears your trade history. Resetting is useful when you want to start a new testing phase with a clean slate, but avoid resetting repeatedly to hide poor results — your trade history is valuable data for understanding what needs to improve.
How realistic is TradingView Paper Trading?
It is realistic in terms of price data, order mechanics, and position tracking — all of which use live market data. It is less realistic for slippage simulation on market orders during volatile conditions, and it cannot replicate the psychological experience of trading real capital. Use it to eliminate mechanical and analytical errors, understanding that emotional discipline is a separate skill developed through live trading with small capital.
How long should I paper trade before going live?
Complete at minimum 30-50 documented trades over at least four weeks, demonstrating consistent application of your risk rules and positive expectancy in your results. The time frame matters less than the trade count and the discipline consistency. A trader who completes 50 well-documented, rule-following paper trades in four weeks is better prepared for live trading than one who places 200 undisciplined trades over three months.
