
TradingView Volume Profile: Complete Setup & How to Use It (2026)
This article contains affiliate links. If you sign up for TradingView through a link on this page, I may earn a commission at no extra cost to you. I only recommend tools I have genuinely evaluated.
Trading involves risk. Technical analysis tools, including volume profile, do not guarantee profitable results. Past performance is not indicative of future results. Always manage your risk appropriately.
TradingView Volume Profile is one of the most useful paid charting features for traders who want to see where volume actually traded across price levels — not just when volume occurred. You keep seeing it mentioned in trading discussions, but every time you try to add it to a chart on the free plan, you hit a paywall. I am Andreas Maratheftis, and after 30 years in professional finance I can tell you it is one of the few technical tools that genuinely changes how you read a chart. This guide covers exactly what it is, which TradingView plan you need, how to set it up, and how to use it so it actually improves your analysis.
Quick Answer
TradingView includes volume profile as a built-in feature, but it requires a paid plan — Essential or higher. The free Basic plan does not include it. Once unlocked, you can access several built-in Volume Profile tools: Visible Range, Session, and Periodic are standard indicators; Fixed Range and Anchored Volume Profile are drawing tools applied from the left toolbar rather than the Indicators menu. The core concept is simple: instead of showing when volume happened (vertical bars at the bottom), volume profile shows where it happened — as a horizontal histogram mapped to price levels. The peak of that histogram is the Point of Control (POC), the single price level where the most volume traded.
Start your 30-day free trial of TradingView Essential and unlock Volume Profile today.
What Is Volume Profile and Why Does It Matter?
The volume profile is an advanced charting study that maps trading volume to specific price levels over a defined time period. The result is a horizontal histogram running along the right side of your chart — taller bars where more volume traded, shorter bars where less volume traded.
The practical value is straightforward. Standard volume bars at the bottom of a chart tell you when the market was active. Volume profile tells you where the market agreed on price. Those are different questions, and for traders using technical analysis to identify support, resistance, and likely reversal zones, the “where” question is often more useful than the “when” question.
In institutional analysis — where I spent the first decade of my career — price levels are never evaluated in isolation. Context matters: has this level been tested before, and how much volume supported it? That question is answered directly by the histogram. Retail traders now have access to a similar style of volume-at-price analysis through TradingView, even if the exact data quality depends on the asset, exchange, and data feed being used.
Volume Profile Terminology: The Six Terms You Need
Before touching the settings, fix these six terms in your mind. Every strategy using it reduces to combinations of these concepts.
| Term | What It Means | How Traders Use It |
|---|---|---|
| Point of Control (POC) | The price level with the highest traded volume in the profile period — the longest bar in the histogram | Acts as a mean-reversion magnet; price tends to revisit it. Used as dynamic support/resistance |
| Value Area (VA) | The price range containing 70% of total volume traded in the period | Price inside the VA is considered balanced/fair value. Price outside it signals a directional move or extension |
| Value Area High (VAH) | The upper boundary of the Value Area | Resistance when price approaches from below; breakout confirmation if price closes above it |
| Value Area Low (VAL) | The lower boundary of the Value Area | Support when price approaches from above; breakdown confirmation if price closes below it |
| High Volume Node (HVN) | A cluster of bars with above-average volume — where the market spent significant time agreeing on price | Acts as strong support or resistance; price often consolidates at HVNs |
| Low Volume Node (LVN) | A gap between HVNs where volume was thin — the market moved through quickly | Price moves rapidly through LVNs. Useful for identifying breakout targets and fast-travel zones |
The 70% Value Area convention is not arbitrary. It mirrors one standard deviation in a normal distribution — the same statistical principle used in auction market theory to define fair value. Memorise these six terms and the rest of the guide is simply applying them.
Which TradingView Plan Do You Need for Volume Profile?
Volume profile is not available on the free Basic plan. When you try to add it on the free plan, TradingView shows an upgrade prompt — you will see exactly this screen.
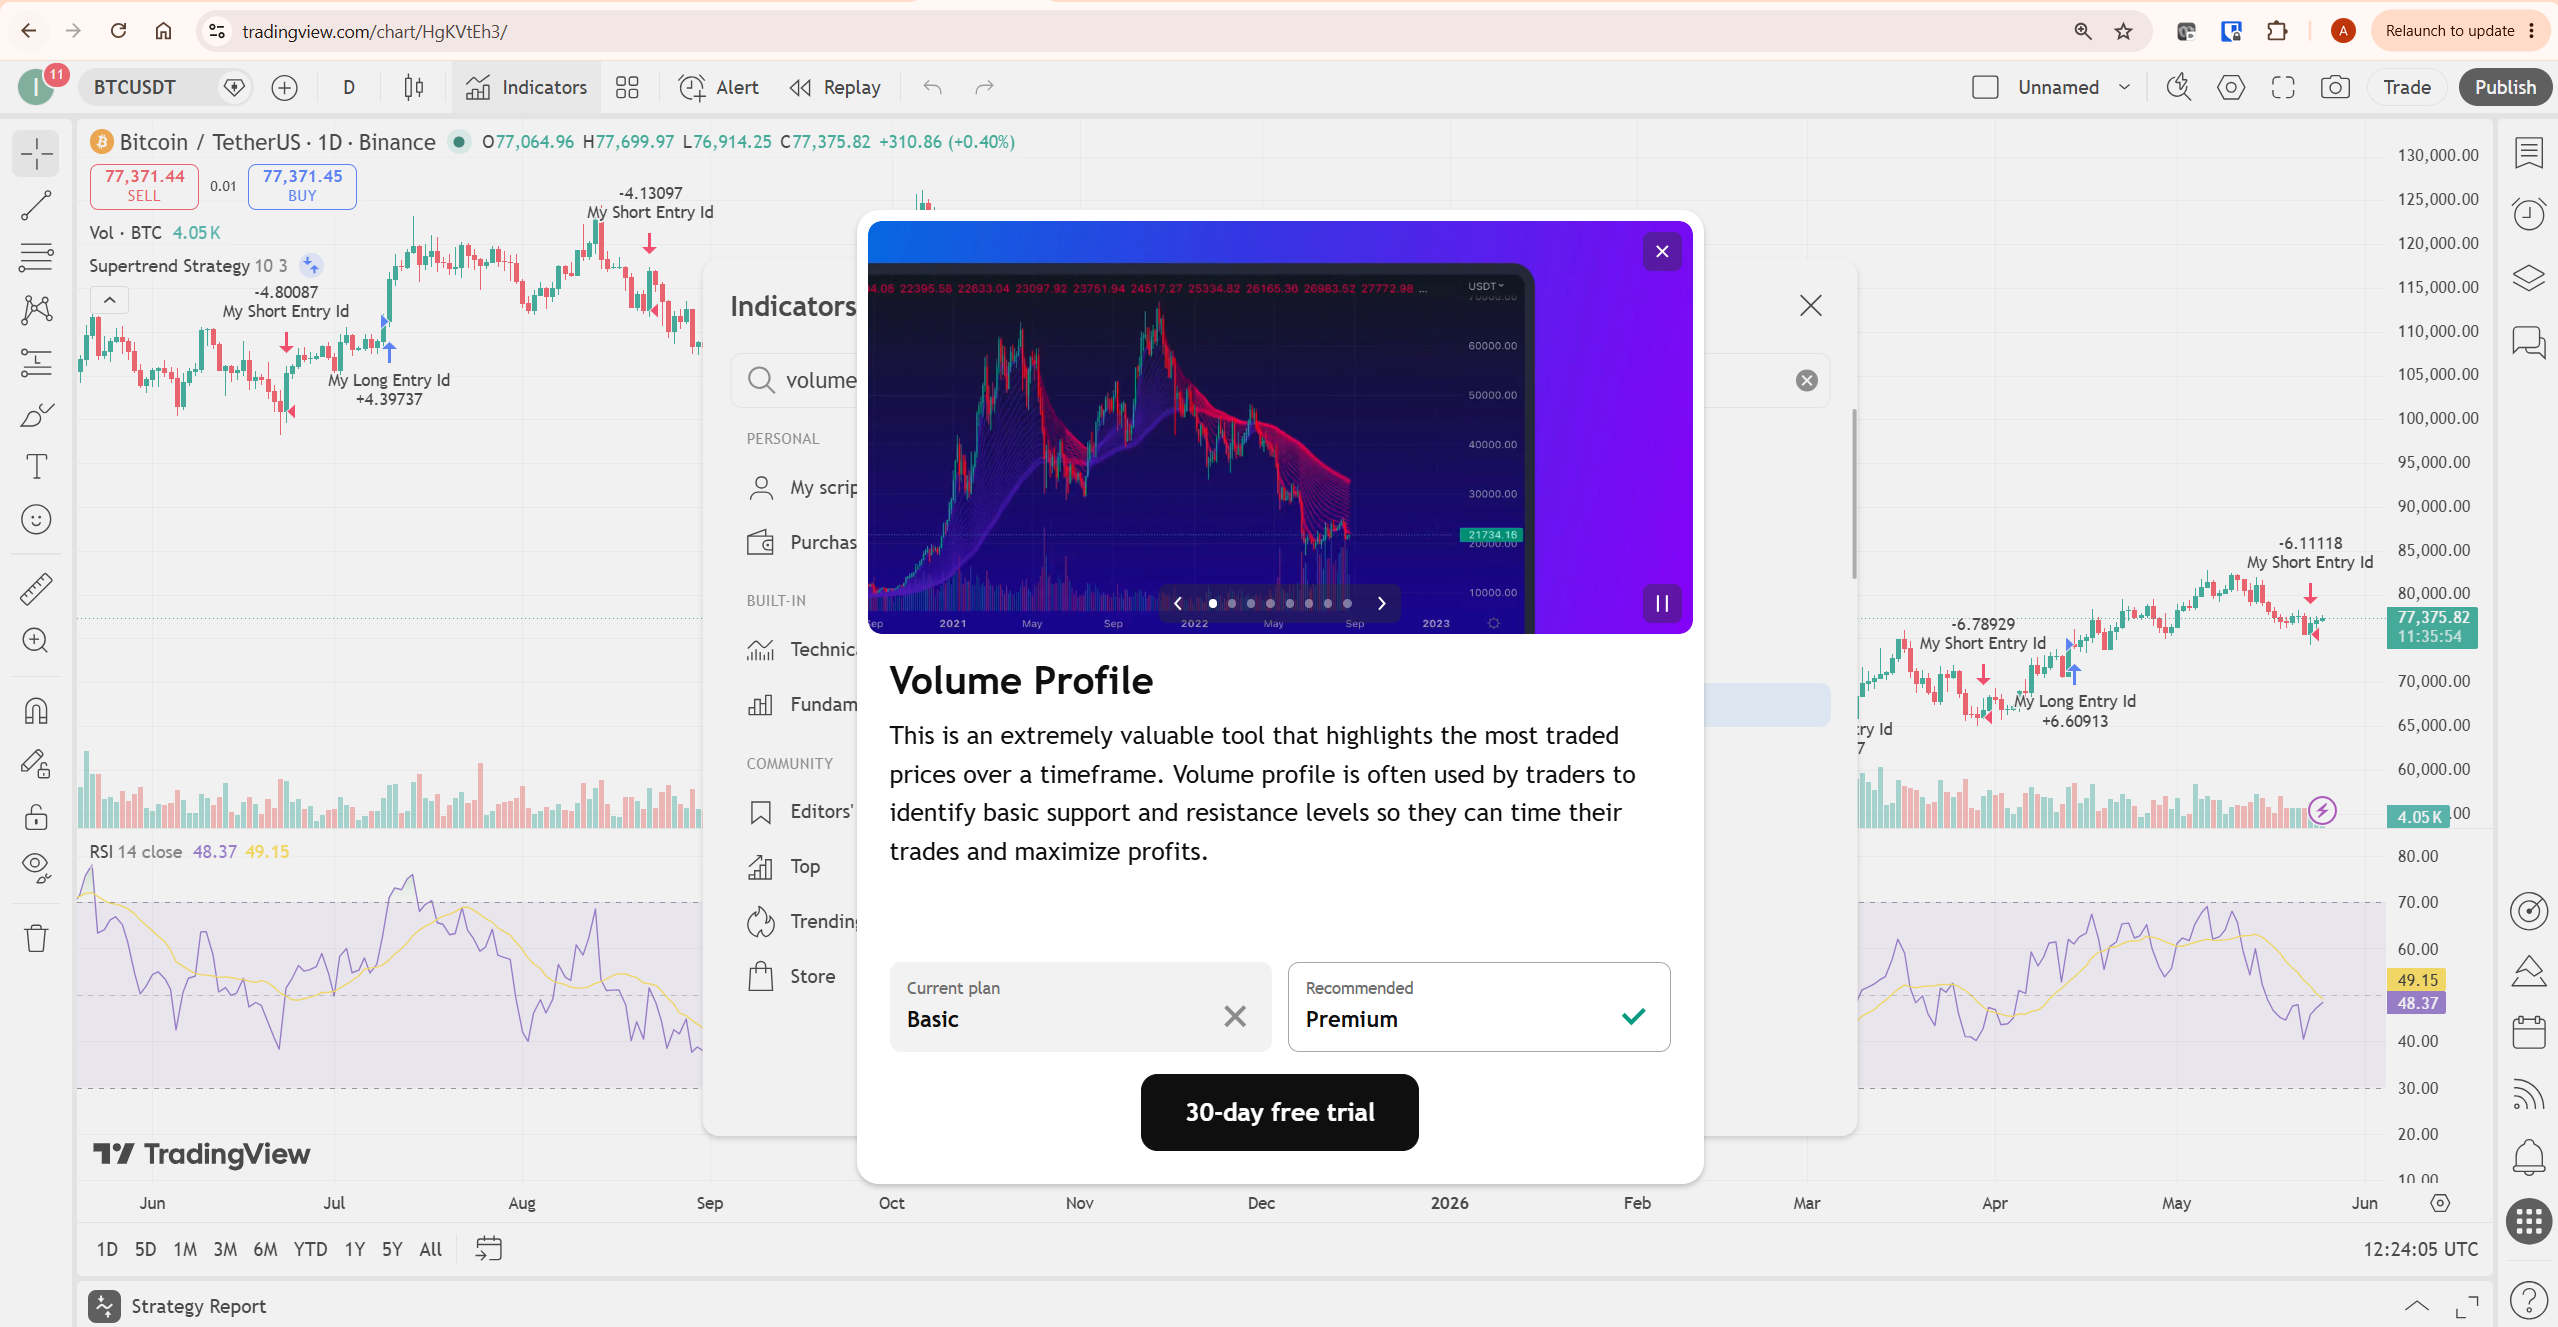
The Essential plan is the right entry point for most traders who want this feature. Here is what each plan costs and what you get:
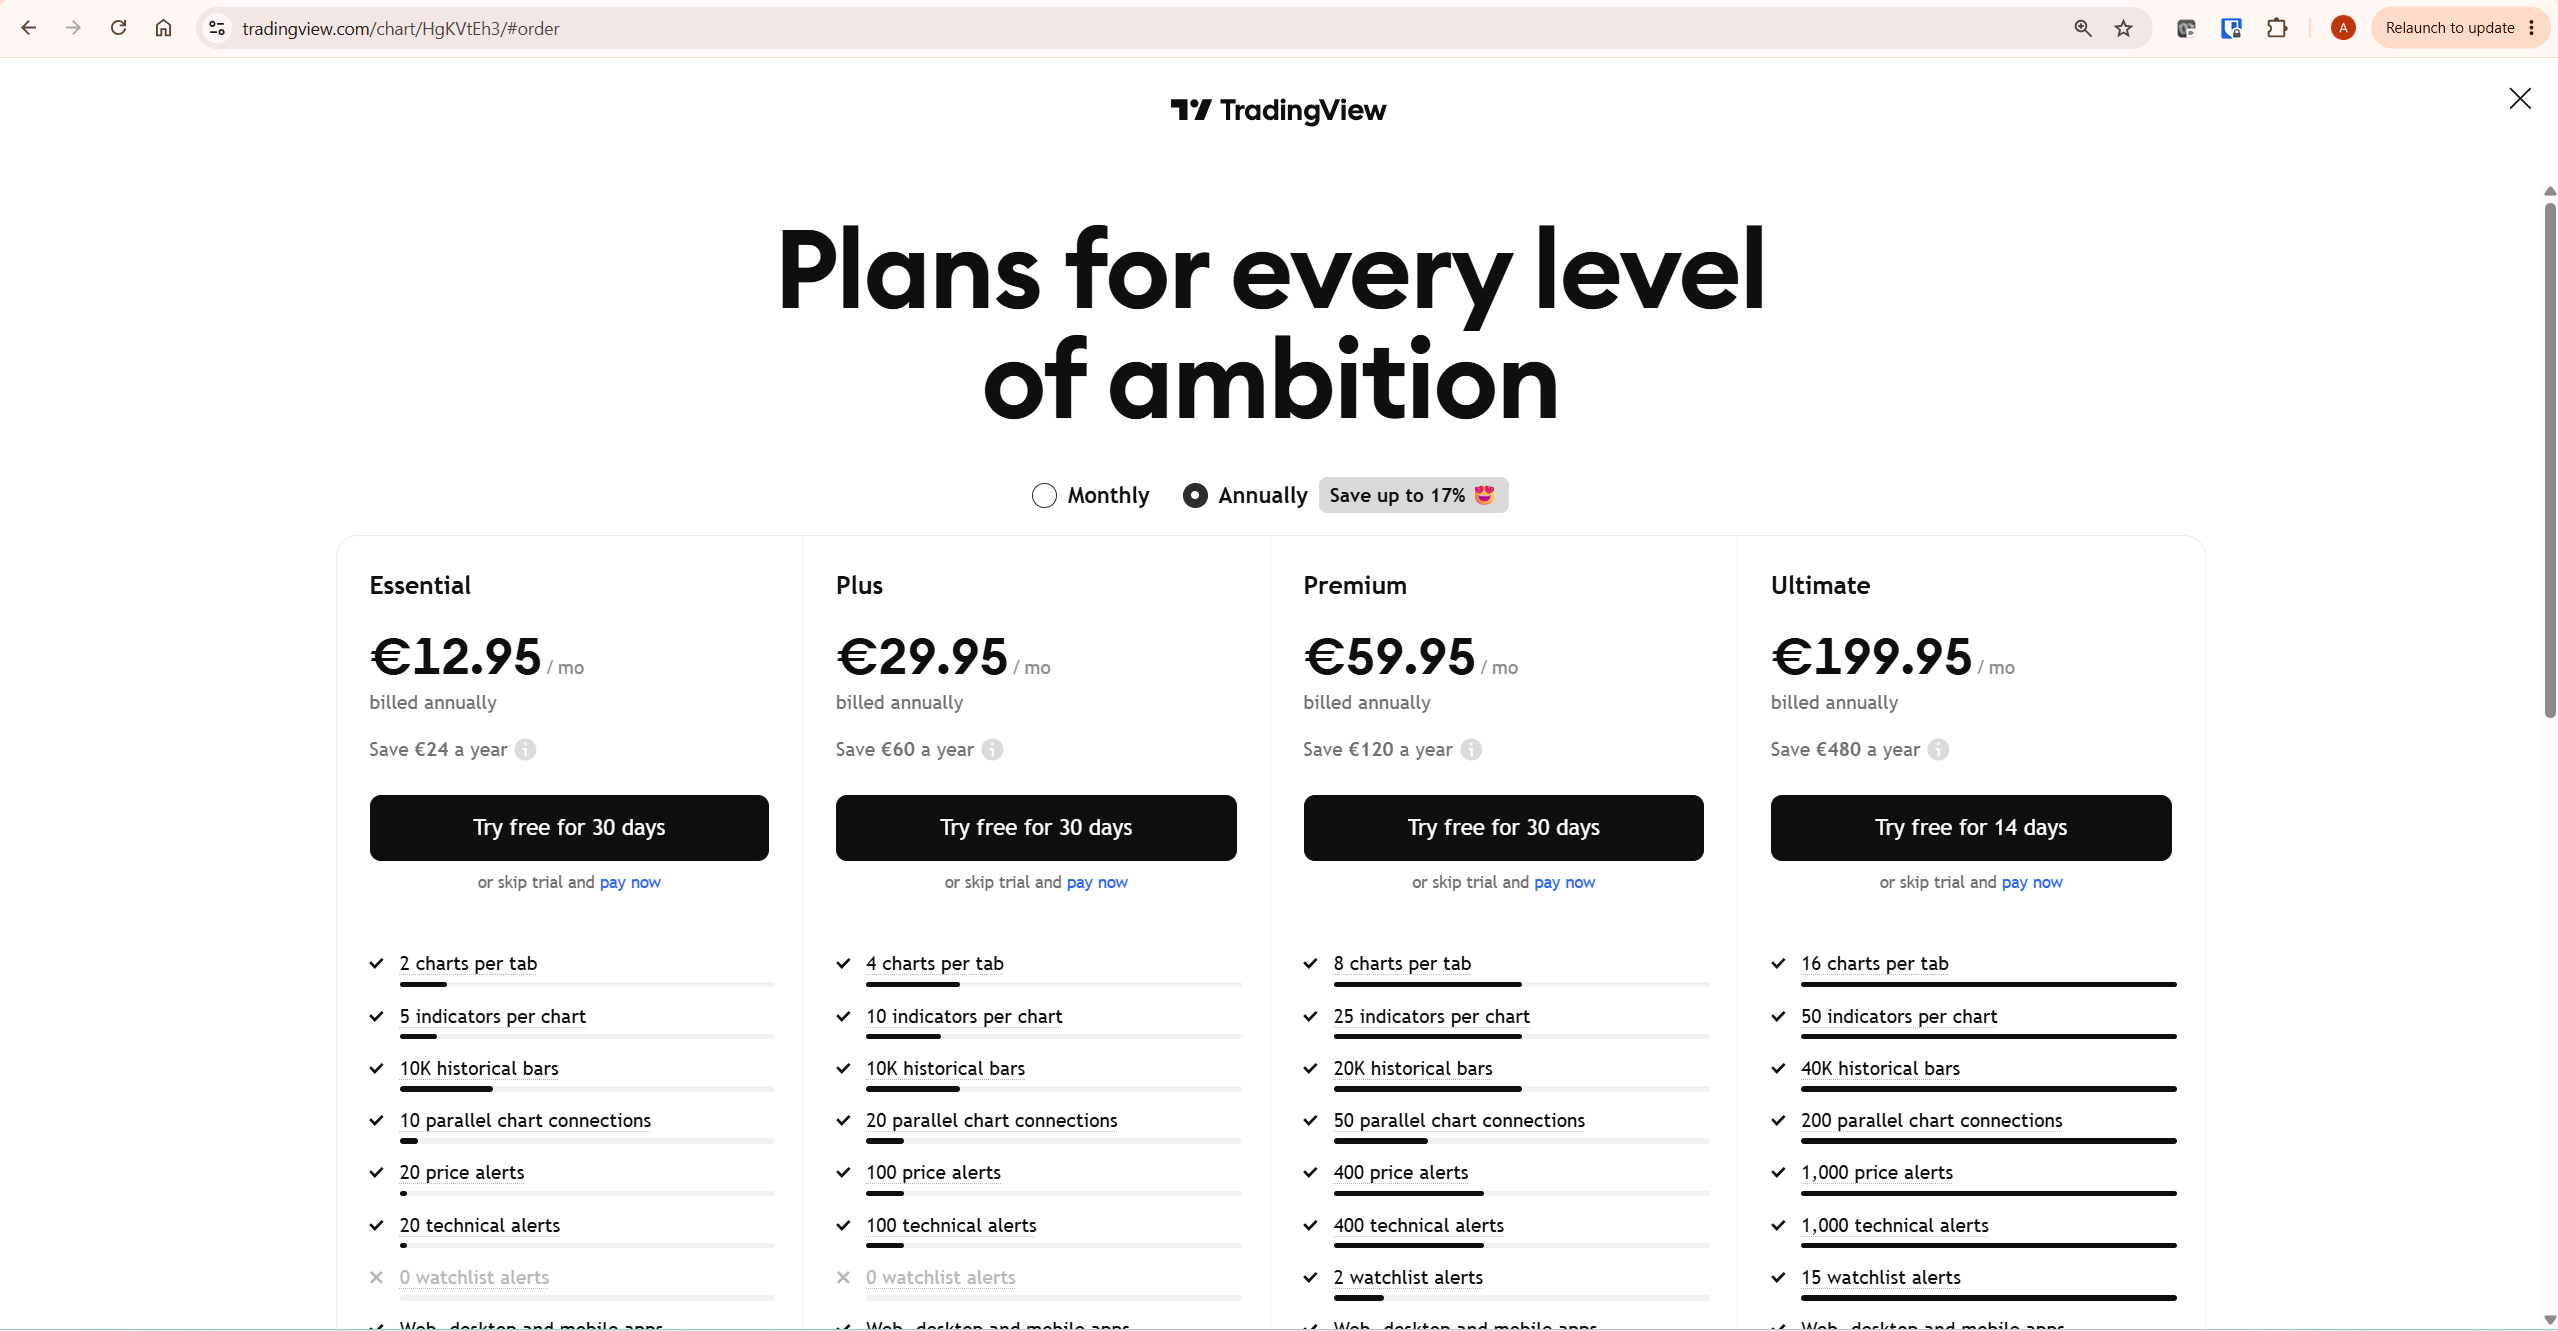
| Plan | Annual Price | Volume Profile | Charts Per Tab | Indicators Per Chart | Best For |
|---|---|---|---|---|---|
| Basic (Free) | Free | Not included | 1 | 3 | Learning the platform only |
| Essential | $155.40/yr ($12.95/mo equivalent) | Included — VRVP, Fixed Range, Session, Periodic | 2 | 5 | Swing traders, crypto traders using VP for S/R |
| Plus | $299.40/yr ($24.95/mo equivalent) | Included — all variants including Anchored VP | 4 | 10 | Active traders needing multi-timeframe VP analysis |
| Premium | $599.40/yr ($49.95/mo equivalent) | Included — all variants, 20K historical bars | 8 | 25 | Day traders running session VP across multiple instruments |
Anchored Volume Profile and Fixed Range Volume Profile are drawing tools, not standard indicators — both are found in the left toolbar under the measurement tools group, not the Indicators menu. Anchored VP requires Plus or higher. Visible Range, Session, and Periodic VP are available from Essential upward. Always verify current plan access and pricing at tradingview.com/pricing before subscribing, as features and prices are updated periodically.
Cost perspective: If the annual Essential price in your region is around $155.40, that works out to roughly $0.62 per trading day based on 252 trading days. Whether that is worth it depends entirely on whether this becomes part of your regular analysis process — not simply whether the feature is available.
For a full breakdown of every plan feature, see our TradingView Free vs Paid guide. If you are ready to unlock Volume Profile now, the Essential plan includes a 30-day free trial — start it here and add Volume Profile to your charts today.
How to Add Volume Profile to a TradingView Chart
Adding the standard Volume Profile indicators takes four clicks once you are on a paid plan. Fixed Range and Anchored Volume Profile are drawing tools, so they are added from the left toolbar instead. Here is the process for the standard indicators.
- Open any chart on TradingView
- Click the Indicators button in the top toolbar (the flask icon)
- Type “volume profile” in the search box
- Under the TECHNICALS section, select the variant you want — start with Visible Range Volume Profile
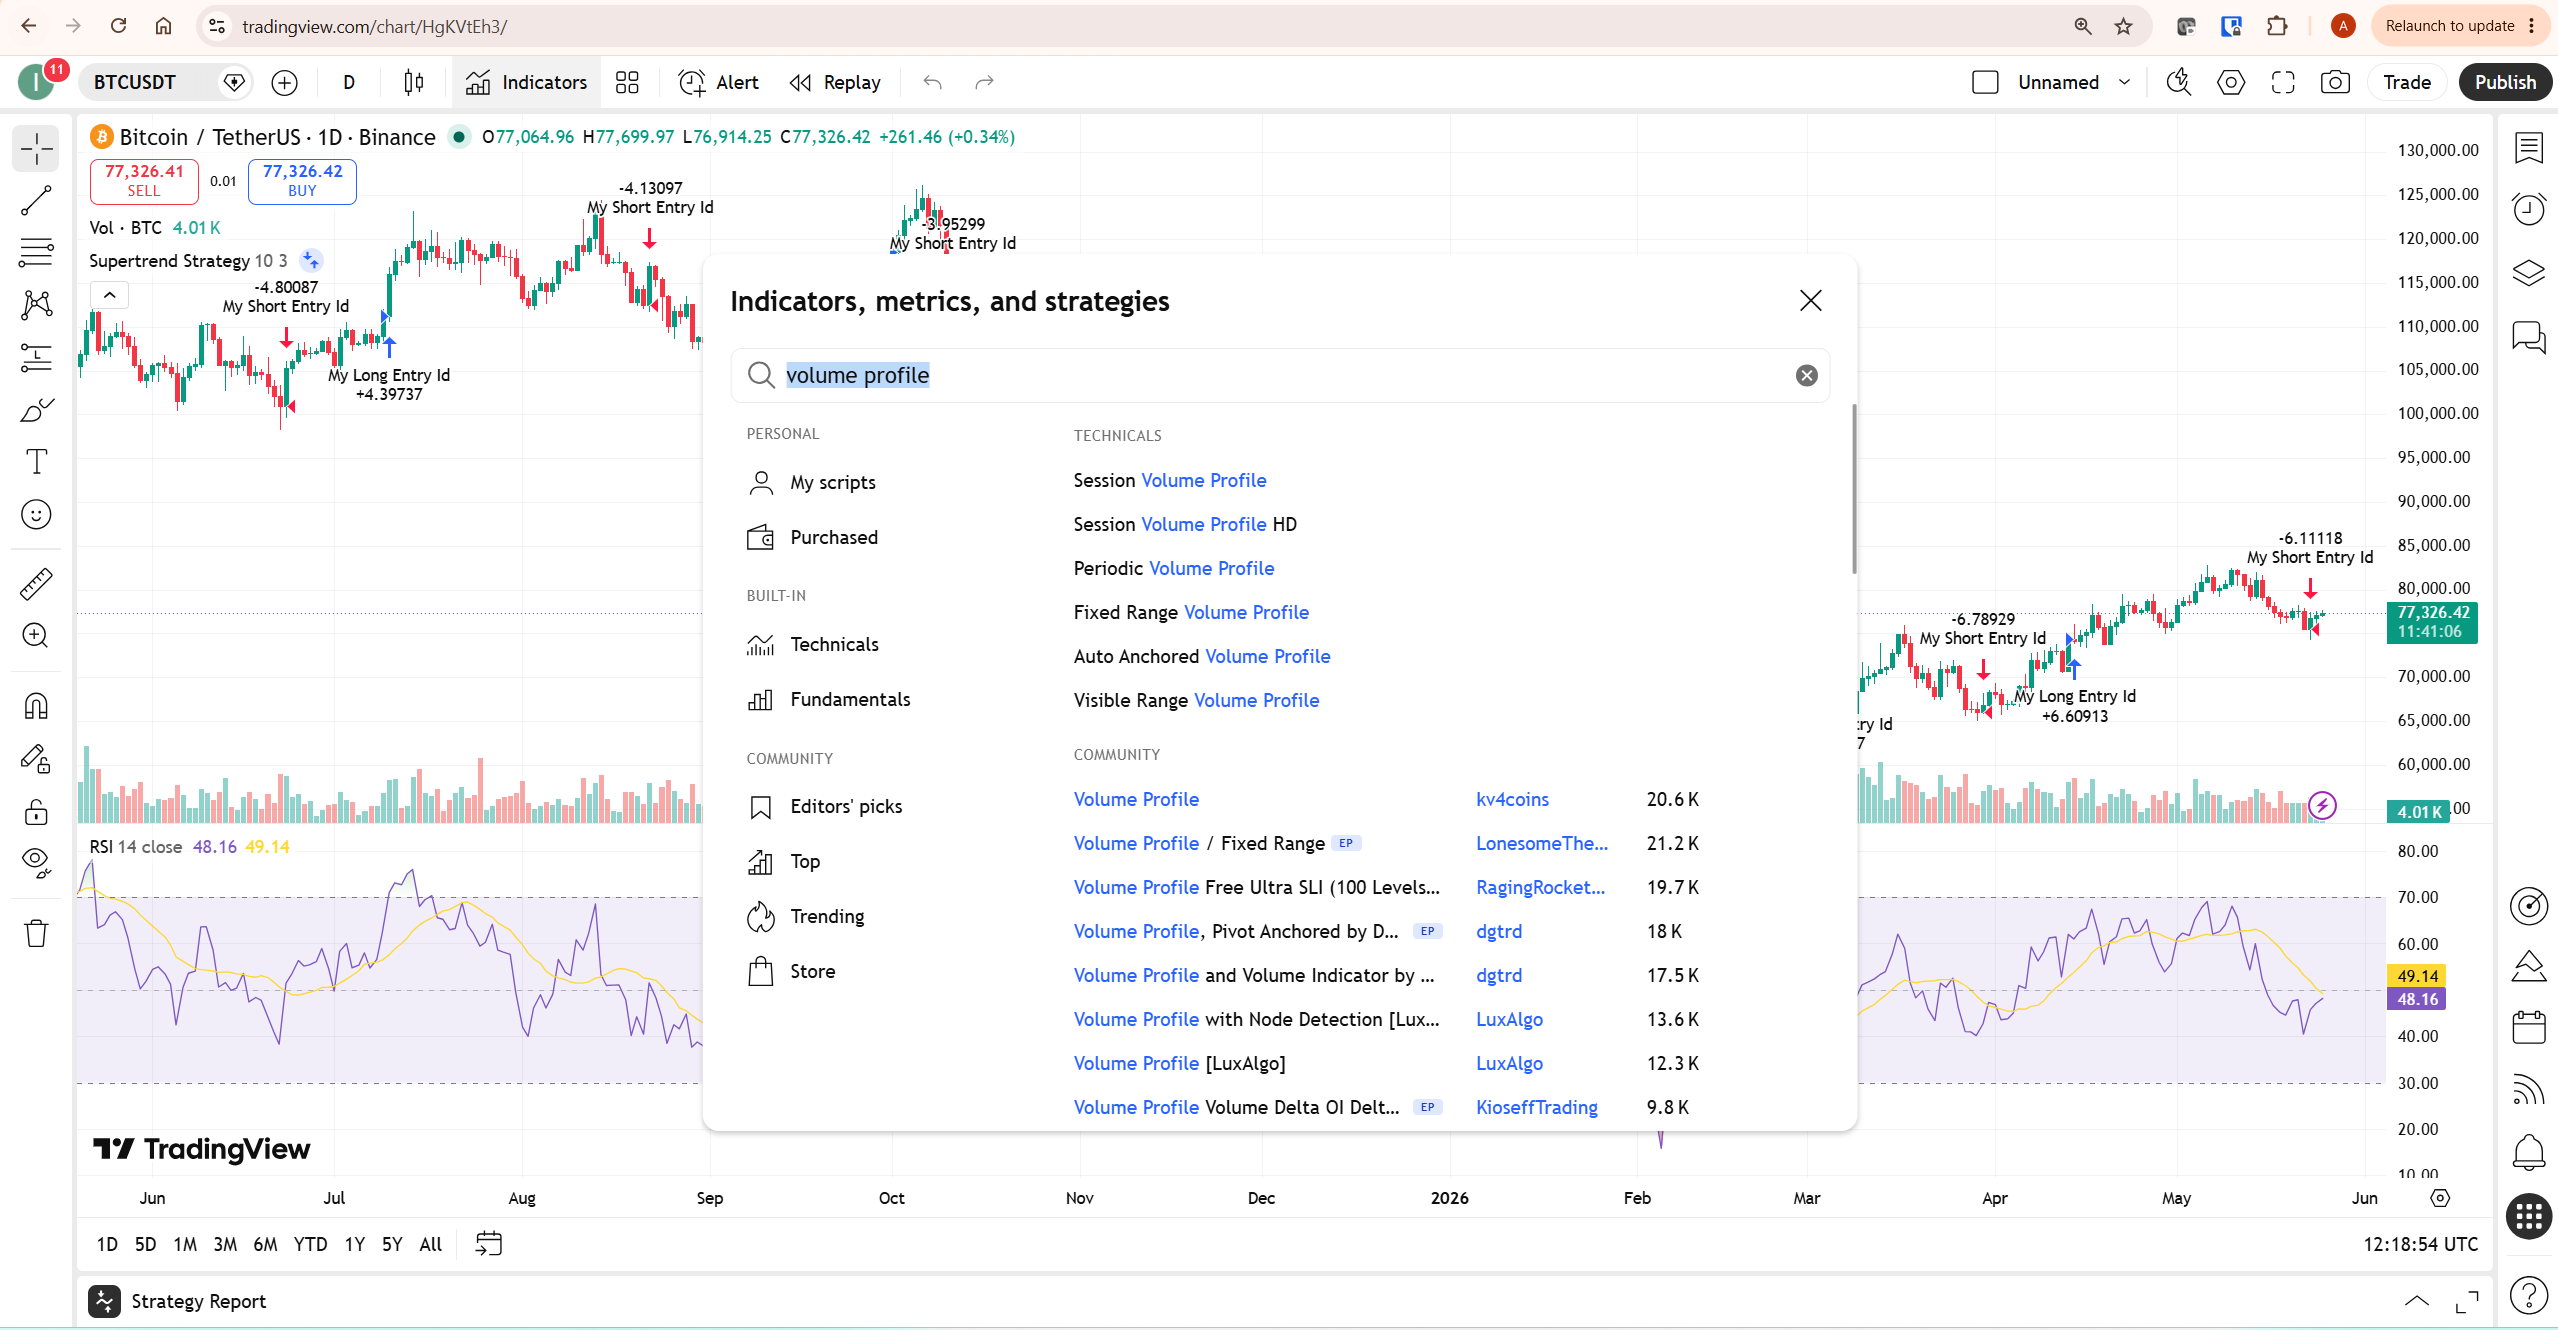
The histogram appears immediately on the right side of the chart. The longest bar marks the POC. The shaded region marks the Value Area. The defaults work without any configuration.
To access the Visible Range Volume Profile on a free TradingView account for comparison purposes, the community-published RS: Market Profile indicator approximates VP using TPO logic and is available without a paid subscription. It is not a replacement for the built-in indicators, but it gives you a working sense of the concept before committing to a plan.
The Five Variants Explained
Each variant answers a different question. Choosing the wrong variant is the most common setup mistake.
Visible Range Volume Profile (VRVP)
VRVP builds its histogram from whatever bars are currently visible on screen. Scroll left and the profile rebuilds. Scroll right and it rebuilds again. This dynamic behaviour makes it the most practical starting point — the histogram always reflects what you are actually analysing. Swing traders use it to identify long-term supply and demand zones across weeks or months of price history.
Fixed Range Volume Profile (VPFR)
VPFR lets you manually define a start and end point on the chart. Draw a box around any specific period — a recent swing, a consolidation zone, a prior week — and it maps the distribution for exactly that range. Unlike VRVP, it does not change as you scroll. Use it when you need to measure a specific event rather than the current view.
Session Volume Profile (SVP)
SVP generates a fresh histogram for each individual trading session. Day traders use this almost exclusively — it shows where the most volume traded within today’s session, giving a real-time read on intraday value and fair price. When the session POC shifts mid-day, it signals a change in where buyers and sellers are agreeing on price. That is actionable information for intraday entries and exits.
Periodic Volume Profile
Periodic VP generates a separate histogram for each period you define — daily, weekly, or monthly. On a weekly chart with the period set to 1, you see a discrete profile bar for each week. It is less commonly used than VRVP or SVP but useful for longer-term structural analysis across multiple periods.
Anchored Volume Profile (AVP)
Anchored VP is a drawing tool, not an indicator — you find it in the left toolbar under the Trend Line group, not in the Indicators menu. It lets you attach a profile to any specific bar or event: an earnings announcement, a Fed decision, a breakout candle, the start of an uptrend. The profile then builds forward from that anchor point, growing with each new bar. It requires Plus or higher. For event-driven analysis — measuring how volume has distributed since a specific catalyst — it is the most precise tool in the set.
For a broader look at TradingView’s charting tools, see our full TradingView review.
Best Volume Profile Settings on TradingView
The default settings are functional, but these five adjustments can make the tool easier to read and more useful for real trading decisions.
Row count: Right-click the indicator, go to Settings, and set Rows Layout to “Number of Rows.” Use 150–200 rows for intraday charts, 100 for daily and higher. The default is around 100 which is acceptable, but more rows give finer price resolution on shorter timeframes.
Volume type: Keep it set to Total. The Up/Down split view stacks bars rather than projecting them from one axis, which makes the histogram harder to read at a glance. Total volume is cleaner for identifying POC and HVNs quickly.
Value Area percentage: Leave it at 70%. This is the most commonly used convention in this type of analysis. Changing it may make your levels less comparable with the way many other traders interpret value areas.
POC line extension: Turn this on. In Settings, enable the POC line to extend to the right edge of the chart. This keeps the most important level visible at all times without needing to scroll back to find where the histogram peak sits.
POC colour: Set it to something that contrasts sharply with your chart theme — bright yellow or cyan on a dark theme. The POC is the level you care about most. It should be immediately visible.
Once configured, right-click the indicator and select “Apply Default Settings” so these carry across to every new chart automatically.
How to Read and Trade With Volume Profile
Reading the histogram correctly comes down to three questions: where is the POC, is price inside or outside the Value Area, and are the nearby nodes high or low volume?
POC as Support and Resistance
The POC often acts like a magnet. Price frequently revisits areas of heavy historical volume because that is where buyers and sellers previously agreed on fair value. When price pulls back toward a prior session’s POC, that level is worth watching for a reaction — not because of a drawing tool or subjective trendline, but because real volume supported it. When price breaks decisively through a POC without pausing, that signals the market has rejected that value area and is searching for a new one.
Value Area: Inside vs Outside
Price inside the Value Area is balanced — buyers and sellers are in relative agreement. Expect slower, choppier price action. Price outside the Value Area is extended — the market is testing whether participants will accept a new price level. The VAH and VAL are the key boundaries. A clean close above the VAH suggests buyers are accepting higher prices and the move has conviction. A rejection at the VAH suggests the market is not yet ready to accept that level as fair value.
HVNs and LVNs in Practice
High Volume Nodes act like speed bumps — price slows down and often consolidates when it reaches a price level where a lot of volume previously traded. Use them as support and resistance zones rather than exact lines. Low Volume Nodes are the opposite — thin areas where price moved through quickly with little agreement. When price enters an LVN, it tends to accelerate toward the next HVN. For breakout traders, LVNs are the zones to watch: a genuine breakout through a HVN will often move rapidly through the adjacent LVN before finding the next level of acceptance.
Combining SVP and VRVP
Running both Session VP and VRVP simultaneously gives you two frames of reference: the intraday structure and the longer-term structure. When the session POC aligns with a long-term HVN from the second indicator, that confluence is significantly stronger than either signal alone. That is where institutional order flow tends to concentrate, and where the highest-probability reactions occur.
If you use TradingView’s alert system to flag when price approaches these key levels, see our TradingView Alerts guide for the full setup process.
Volume Profile vs VWAP: Which One to Use
These two tools are frequently confused because both involve volume and price. They answer different questions and are best used together rather than as alternatives.
The tool maps where volume concentrated across price levels over a defined period — giving you a structural picture of where the market has historically agreed on value. VWAP shows the volume-weighted average price across time — a running benchmark of where the average transaction has occurred since the session opened.
In practice: use the histogram for identifying significant price levels to watch before the session opens. Use VWAP for execution context during the session — is price above or below the average transaction price right now? The two tools are complementary. A POC level that also aligns with VWAP is a notably stronger confluence point than either in isolation.
Common Volume Profile Mistakes to Avoid
The most common mistake is treating the POC, VAH, or VAL as automatic entry signals. They are decision zones, not guarantees. Wait for confirmation from price action, volume expansion, or your existing trading rules before acting on them.
The second mistake is using too much chart history. If your visible range spans months of unrelated price action, the profile becomes too broad to help with your current trade decision. Match the range to the trade you are actually analysing — a recent swing or a specific consolidation period, not the entire chart history.
The third mistake is ignoring the data source. A histogram on a liquid futures contract reflects centralised exchange volume. The same tool on a thin CFD or low-volume crypto pair reflects different quality data. Always check the symbol and exchange feed before relying heavily on these levels.
Honest Limitation: What Volume Profile Cannot Do
Volume profile is a reactive tool. It maps what already happened — where trades occurred in the past — not what will happen next. A POC level can be broken cleanly without any reaction. A Value Area can expand significantly if a news event or macro catalyst overrides the existing structure. Traders who treat these levels as predictive rather than contextual get stopped out repeatedly at what should have been “strong” levels.
The correct mental model: the histogram tells you where the market has historically accepted price. It does not guarantee the market will accept it again. Use these levels as decision zones to watch for confirmation — a specific candlestick pattern, an alert trigger, a volume spike — rather than as automatic entry signals. For an independent assessment of TradingView’s full feature set, see the StockBrokers.com TradingView review.
Volume data quality depends on the market and data source. Exchange-traded stocks and futures typically use centralised exchange volume, which is the most reliable input for this analysis. Forex and broker-fed CFD symbols may rely on tick volume or broker-provided data rather than centralised exchange volume. For crypto, volume quality depends on the specific exchange feed selected. This distinction matters for how much weight you put on VP levels across different markets.
What To Do Next
Open your TradingView chart on BTC/USD or any instrument you trade regularly. Add the Visible Range VP from the Indicators menu. Identify the POC — the longest bar in the histogram — and mark the Value Area High and Low. Then watch how price behaves the next time it approaches those three levels. Do not trade off them immediately. Spend one week observing how price reacts at POC and VA boundaries before adding VP levels to your actual decision-making process. That one week of observation will tell you more than any guide can.
Try TradingView Essential free for 30 days and start using Volume Profile on your charts today.
Related TradingView Guides
If you are building out your TradingView workflow alongside volume profile, these guides cover the tools that work best alongside it:
- TradingView Alerts Explained — set price alerts at your POC and Value Area levels so you are notified when price approaches a key zone
- TradingView Screener — find instruments worth charting before applying volume profile analysis
- TradingView Free vs Paid — full plan comparison if you are deciding whether Essential is the right tier for your workflow
- TradingView Drawing Tools — covers the left toolbar in detail, including where to find Fixed Range and Anchored Volume Profile
- TradingView Review — complete platform overview including all paid features
Frequently Asked Questions
Does TradingView have volume profile?
Yes. TradingView includes several built-in Volume Profile tools: Visible Range (VRVP), Session (SVP), and Periodic are standard indicators added from the Indicators menu. Fixed Range and Anchored Volume Profile are drawing tools applied from the left toolbar. The free Basic plan does not include the built-in Volume Profile tools. Anchored Volume Profile requires Plus or higher.
Is volume profile free on TradingView?
The built-in VP indicators require a paid plan starting with Essential ($155.40/year). The free workaround is the community-published RS: Market Profile indicator, which approximates a volume-weighted profile using TPO logic and works on free accounts. It is not identical to the built-in VP tools but gives you POC and Value Area approximations without a subscription.
What is the Point of Control (POC) in TradingView?
The Point of Control is the price level with the highest traded volume during the profile’s defined time period. It appears as the longest bar in the horizontal histogram. Traders treat the POC as a mean-reversion magnet because it represents the price where the most market participants agreed on value — making it a natural level for price to revisit during pullbacks and consolidations.
What is the best volume profile indicator on TradingView?
For most traders, the Visible Range Volume Profile (VRVP) is the best starting point because it auto-adjusts as you scroll, always reflecting the bars currently on screen. For intraday and day trading, Session VP is more useful because it resets at each session open, giving you fresh intraday structure. For event-driven analysis — measuring volume distribution since a specific catalyst — the Anchored Volume Profile is the most precise tool.
What is the difference between volume profile and VWAP?
The indicator maps where volume concentrated across price levels — a horizontal histogram showing historical value zones. VWAP shows the volume-weighted average price across time — a single line that moves with each new candle. The histogram is best for identifying key structural levels before the session opens. VWAP is best for execution context during the session. Used together, they provide both structure and real-time price location relative to fair value.
Which TradingView plan do I need for volume profile?
Essential is the minimum plan required for the main Volume Profile tools, including Visible Range, Session, and Periodic. Fixed Range VP is also accessible from Essential as a drawing tool. The Anchored Volume Profile drawing tool requires Plus or higher. If you primarily want it for swing trading or crypto analysis, Essential is usually sufficient. Day traders who need Session VP across multiple timeframes simultaneously may find Plus more practical due to the increased chart count.
Can I use volume profile on crypto charts?
Yes. TradingView’s built-in VP indicators work across all asset classes including crypto, stocks, forex, and futures. One important note for crypto traders: TradingView uses tick volume for crypto CFDs rather than actual on-chain or exchange volume. For spot crypto pairs on connected exchanges like Binance, the volume data reflects real trades. The practical impact is minor for most VP analysis, but it is worth knowing when comparing VP levels across different data sources.
Trading disclaimer: Trading involves risk. Technical analysis tools including volume profile do not guarantee profitable results. Past performance is not indicative of future results. Always manage your risk appropriately.
