
TradingView vs Finviz: Honest Comparison for Traders (2026)
Affiliate Disclosure: This article contains affiliate links. If you sign up for TradingView through a link on this page, I may earn a commission at no extra cost to you. I only recommend tools I have genuinely evaluated.
TradingView wins the tradingview vs finviz comparison for most active traders — but that verdict misses the point. These two platforms are not competing for the same job. TradingView is the best charting and analysis platform available to retail traders. Finviz is the best stock screener and market visualisation tool available for free. The real question is not which one to choose — it is whether you need both, and how to use them together without paying twice.
With 30 years of professional finance experience and daily use of both platforms, I can give you a direct answer: for crypto traders and affiliate marketers who use TradingView as their primary research tool, Finviz adds limited value. For US stock traders who need fast fundamental screening and sector heat maps before opening a single chart, Finviz is genuinely indispensable — and its free tier is more capable than most traders realise.
This guide covers every meaningful difference between the platforms, the verdict for your specific trading style, and the most cost-effective way to use both together. If you are not yet on TradingView, you can start a free trial here — no credit card required.
Quick Answer: TradingView vs Finviz
TradingView is the superior platform for charting, technical analysis, alerts, crypto coverage, and Pine Script automation. Finviz is the superior platform for fast US stock screening, fundamental data visualisation, and the iconic sector heat map. For US stock traders, using both together — Finviz free for morning scans, TradingView for chart analysis — is the most effective and cost-efficient professional setup available. For crypto traders, TradingView is the clear choice and Finviz adds minimal value.
TradingView vs Finviz: Platform Overview
Understanding what each platform is actually built to do resolves most of the tradingview vs finviz confusion before any feature comparison begins.
| Feature | TradingView | Finviz |
|---|---|---|
| Platform type | Charting and analysis platform | Stock screener and market visualisation tool |
| Primary strength | Advanced charting, indicators, Pine Script | Fast stock screening, heat maps, fundamental data |
| Asset coverage | Global — stocks, crypto, forex, futures, indices | Primarily US stocks and ETFs |
| Free plan data | Real-time on most markets | Delayed 15-20 minutes |
| Crypto coverage | 2,800+ instruments across all major exchanges | Basic overview only — not suitable for crypto trading |
| Mobile app | Yes — iOS and Android | No — web browser only |
| Paid plan | $12.95–$199.95/month | Finviz Elite — $24.96/month (annual) or $39.50/month |
| Community | 20+ million traders, published ideas and scripts | No social or community features |
| Pine Script / custom tools | Yes — full Pine Script v6 | No scripting capability |
| Best for | Technical analysis across all asset classes | US stock screening and market overview |
TradingView is a charting platform that happens to include a screener. Finviz is a screener that happens to include basic charts. That asymmetry defines the entire tradingview vs finviz comparison — and it means the right choice depends entirely on what stage of the trading process matters most to you.
Charting and Technical Analysis
TradingView wins the charting category decisively — and Finviz does not seriously contest it. This is not a close comparison.
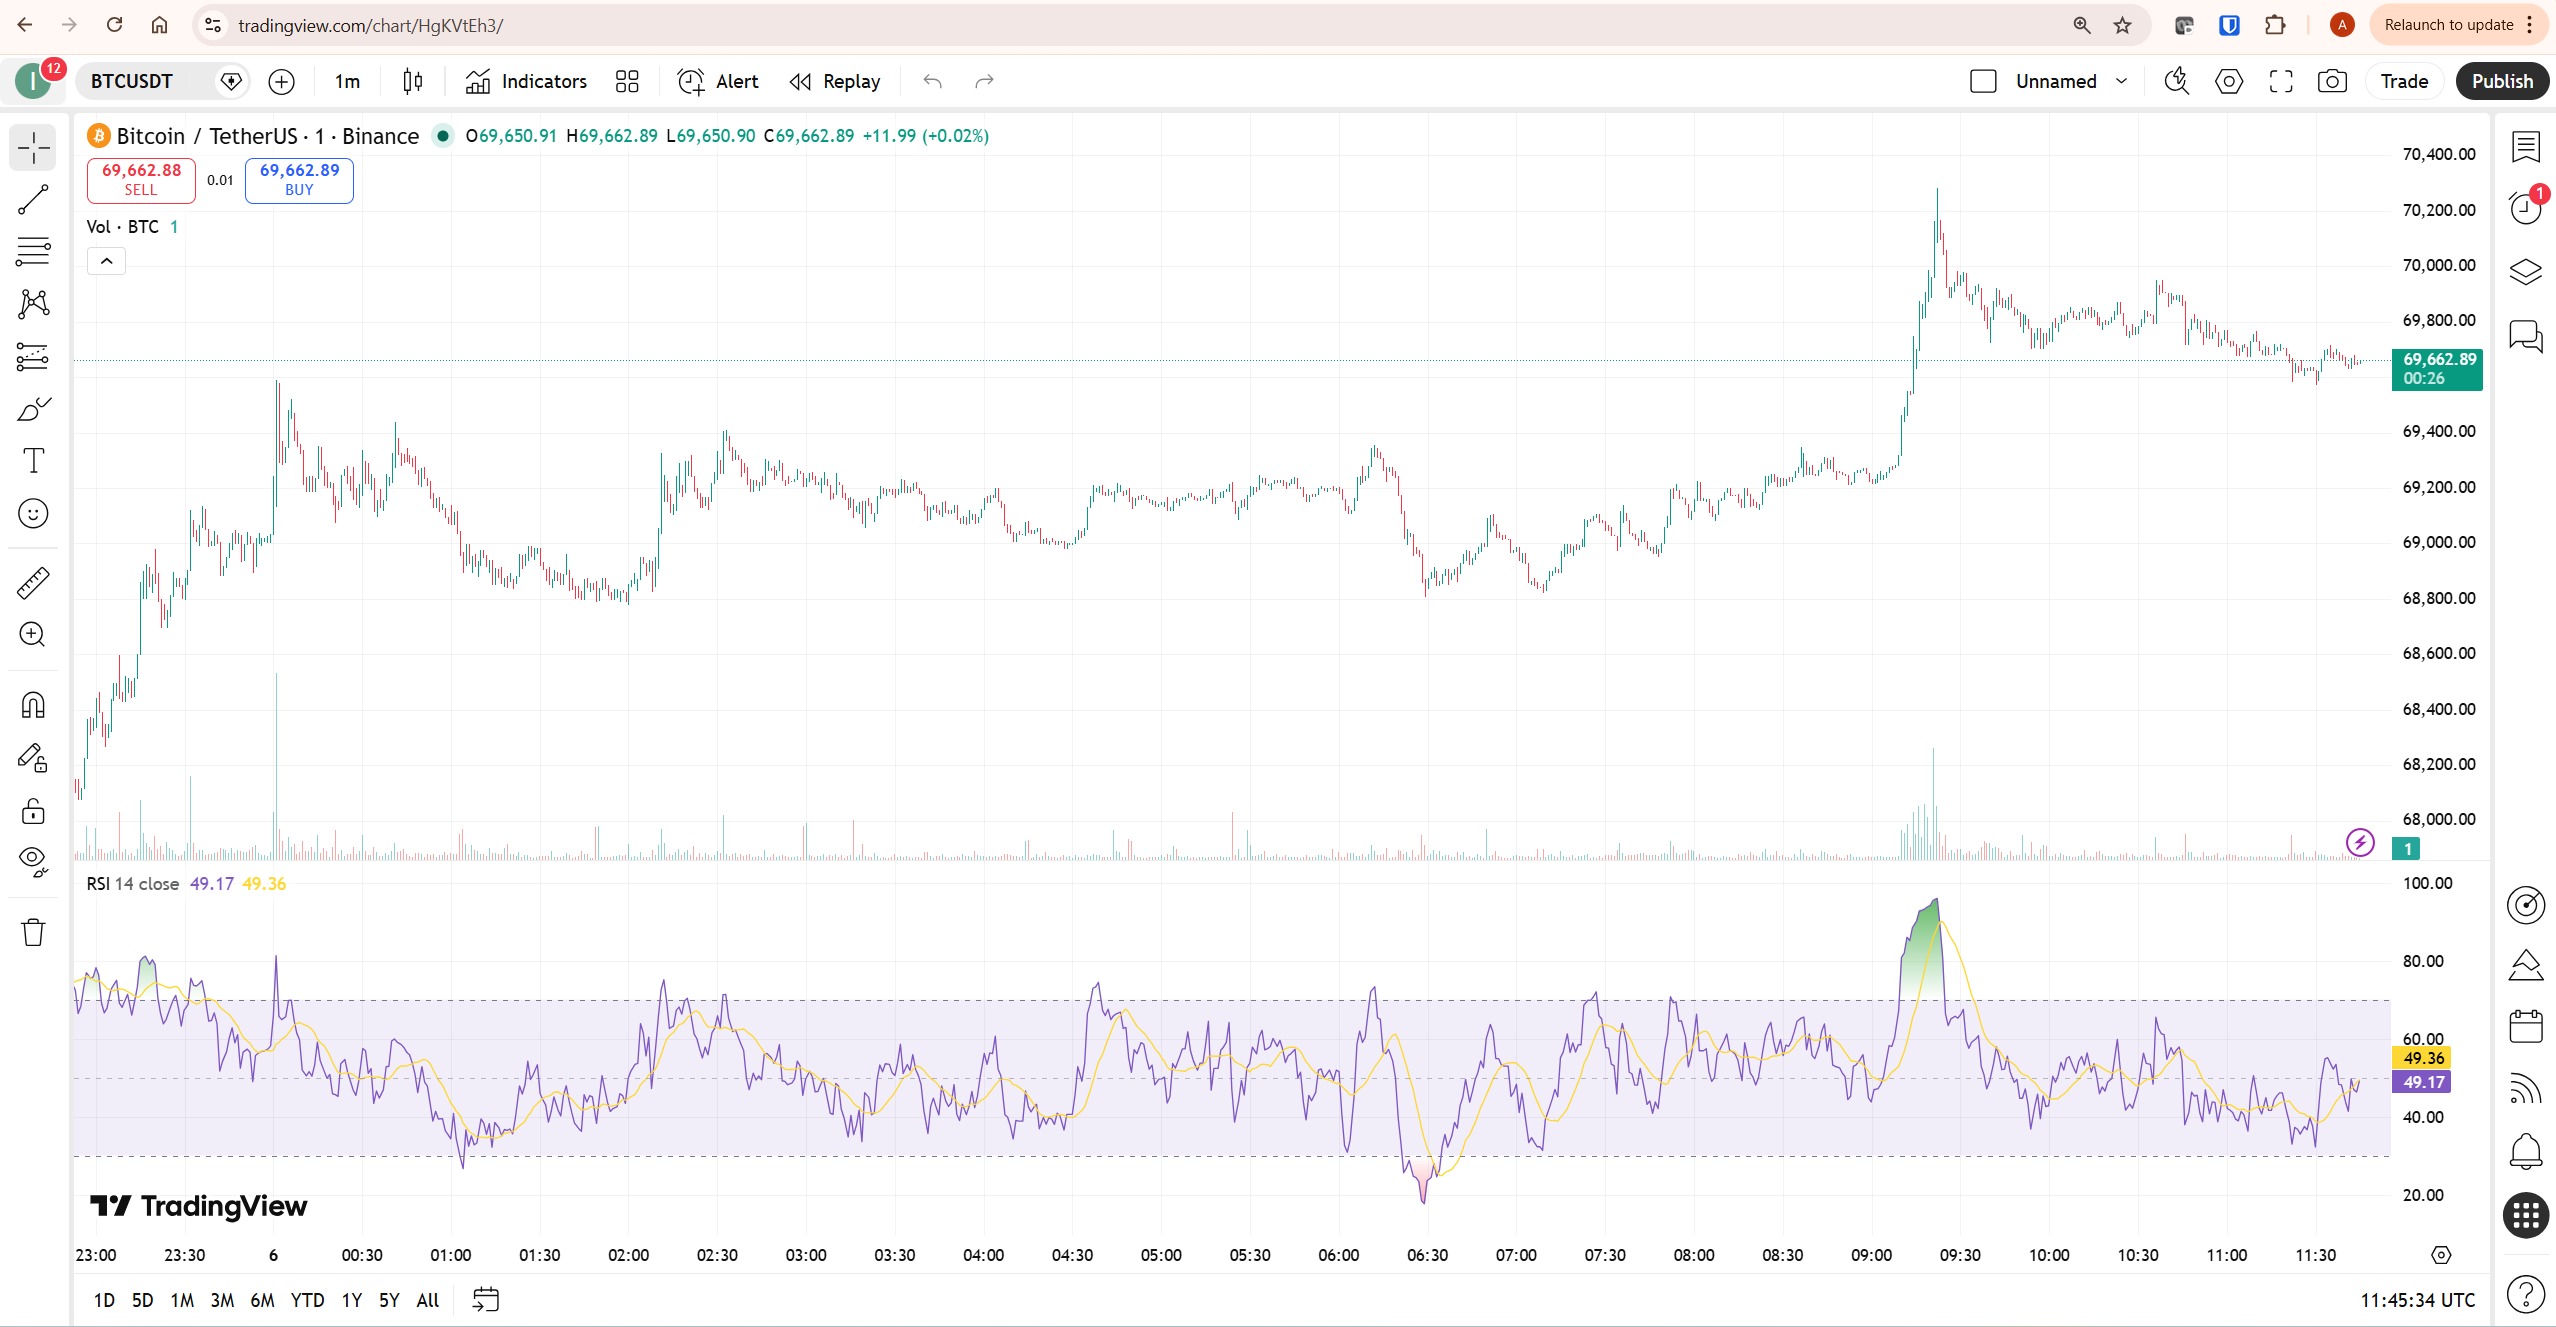
TradingView gives you access to over 100,000 community-published indicators through Pine Script, up to 50 indicators per chart on Ultimate, full multi-timeframe analysis across up to 16 charts per layout, Bar Replay for historical practice, Volume Footprint for order-flow analysis on Premium and above, and a complete strategy backtesting environment. Every drawing tool a technical analyst needs is present and fully interactive.
Finviz’s charts are static images at the free tier. You can view a price chart for any US stock, but you cannot interact with it, add indicators, draw trendlines, or save chart layouts. The Elite plan improves this with more interactive charts and additional technical studies — but even Elite Finviz charts are a significant step below TradingView’s free plan charting capabilities. According to StockBrokers.com’s Finviz review, the charting tool is “serviceable, but far from the best on the market” — which is a fair and accurate summary.
The honest verdict: if technical analysis is any part of your trading methodology, TradingView is the correct charting tool. Finviz’s charts exist to give you a quick price overview before running a screen — they are not an analytical environment. For a full breakdown of TradingView’s charting capabilities, our TradingView review covers the complete platform.
Stock Screening and Market Visualisation
Finviz wins the screening category — and this is where the tradingview vs finviz comparison genuinely becomes competitive. Finviz’s stock screener is the fastest, most visual screening tool available at any price point, and its free tier is more powerful than most traders realise.
The free Finviz screener lets you filter US stocks across over 60 criteria simultaneously — market cap, P/E ratio, sector, volume, RSI, moving average signals, candlestick patterns, short float, insider activity, and many more. Results appear instantly with no loading delay. You can switch between table, chart, and snapshot views of results. The snapshot view — showing a small price chart, key metrics, and insider trading data for every result on a single page — is uniquely efficient for scanning large numbers of candidates quickly.
The Finviz heat map is the platform’s most iconic feature and the one that genuinely has no equivalent on TradingView. It displays the entire S&P 500 as a colour-coded treemap — green for gainers, red for losers — sized by market capitalisation and grouped by sector. A single glance tells you which sectors are leading, which are lagging, and where volume and momentum are concentrated across the entire market.
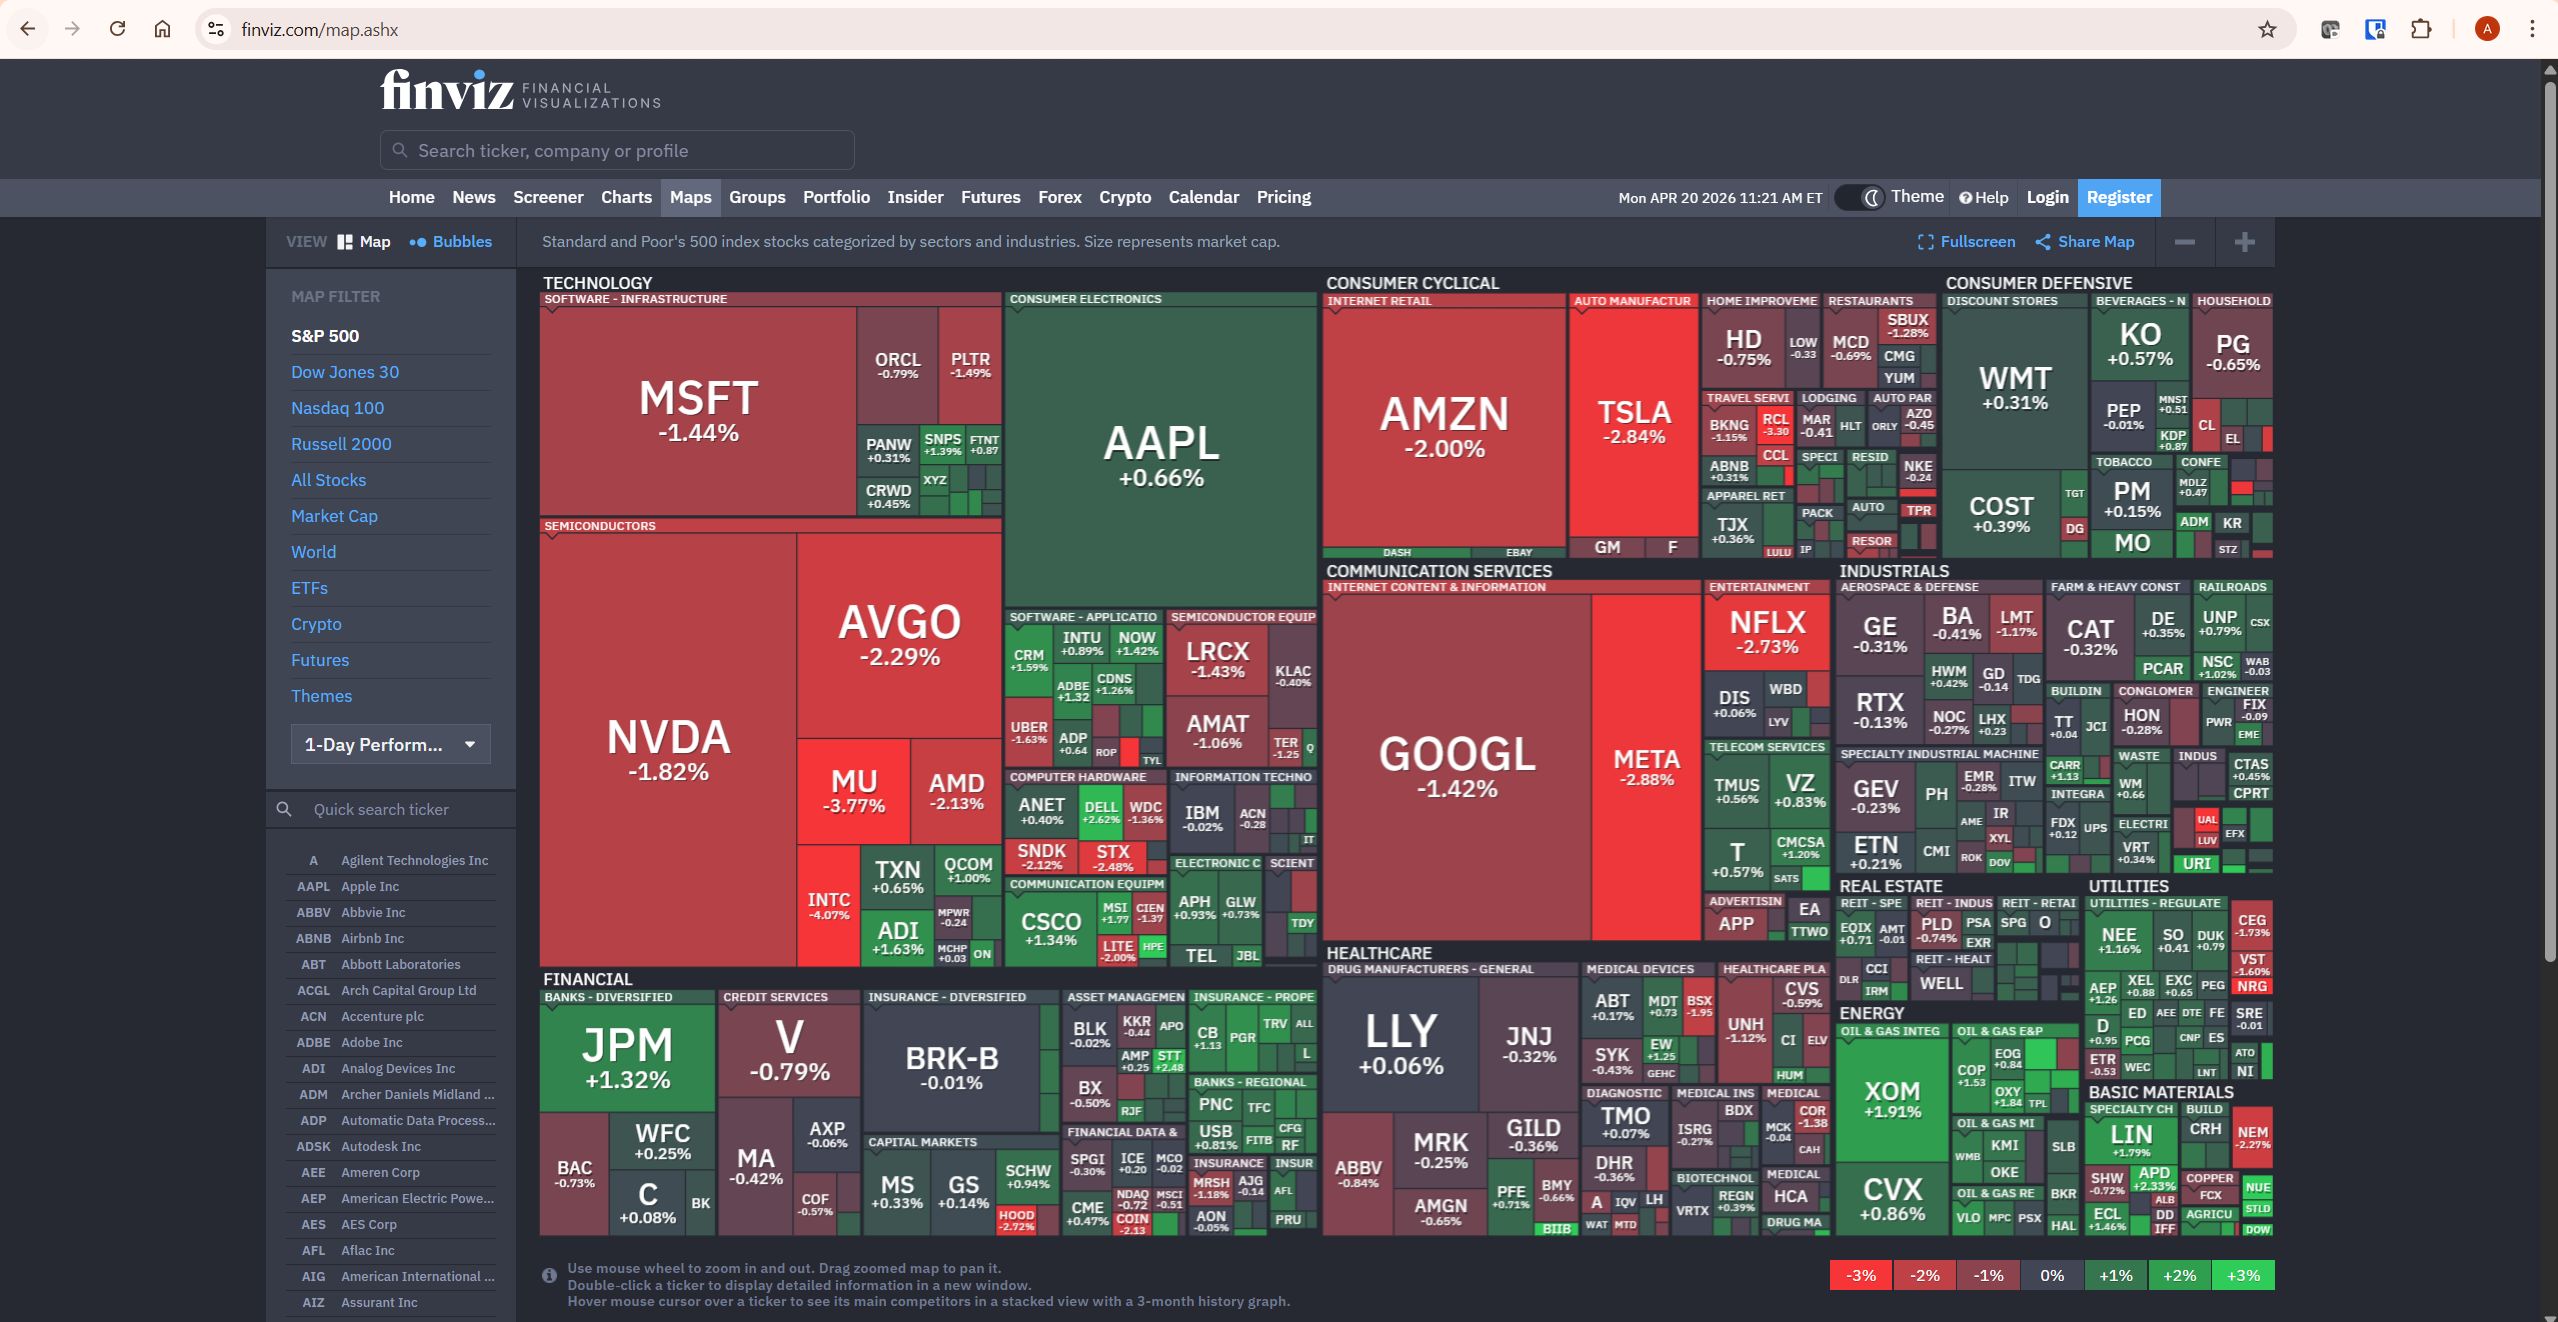
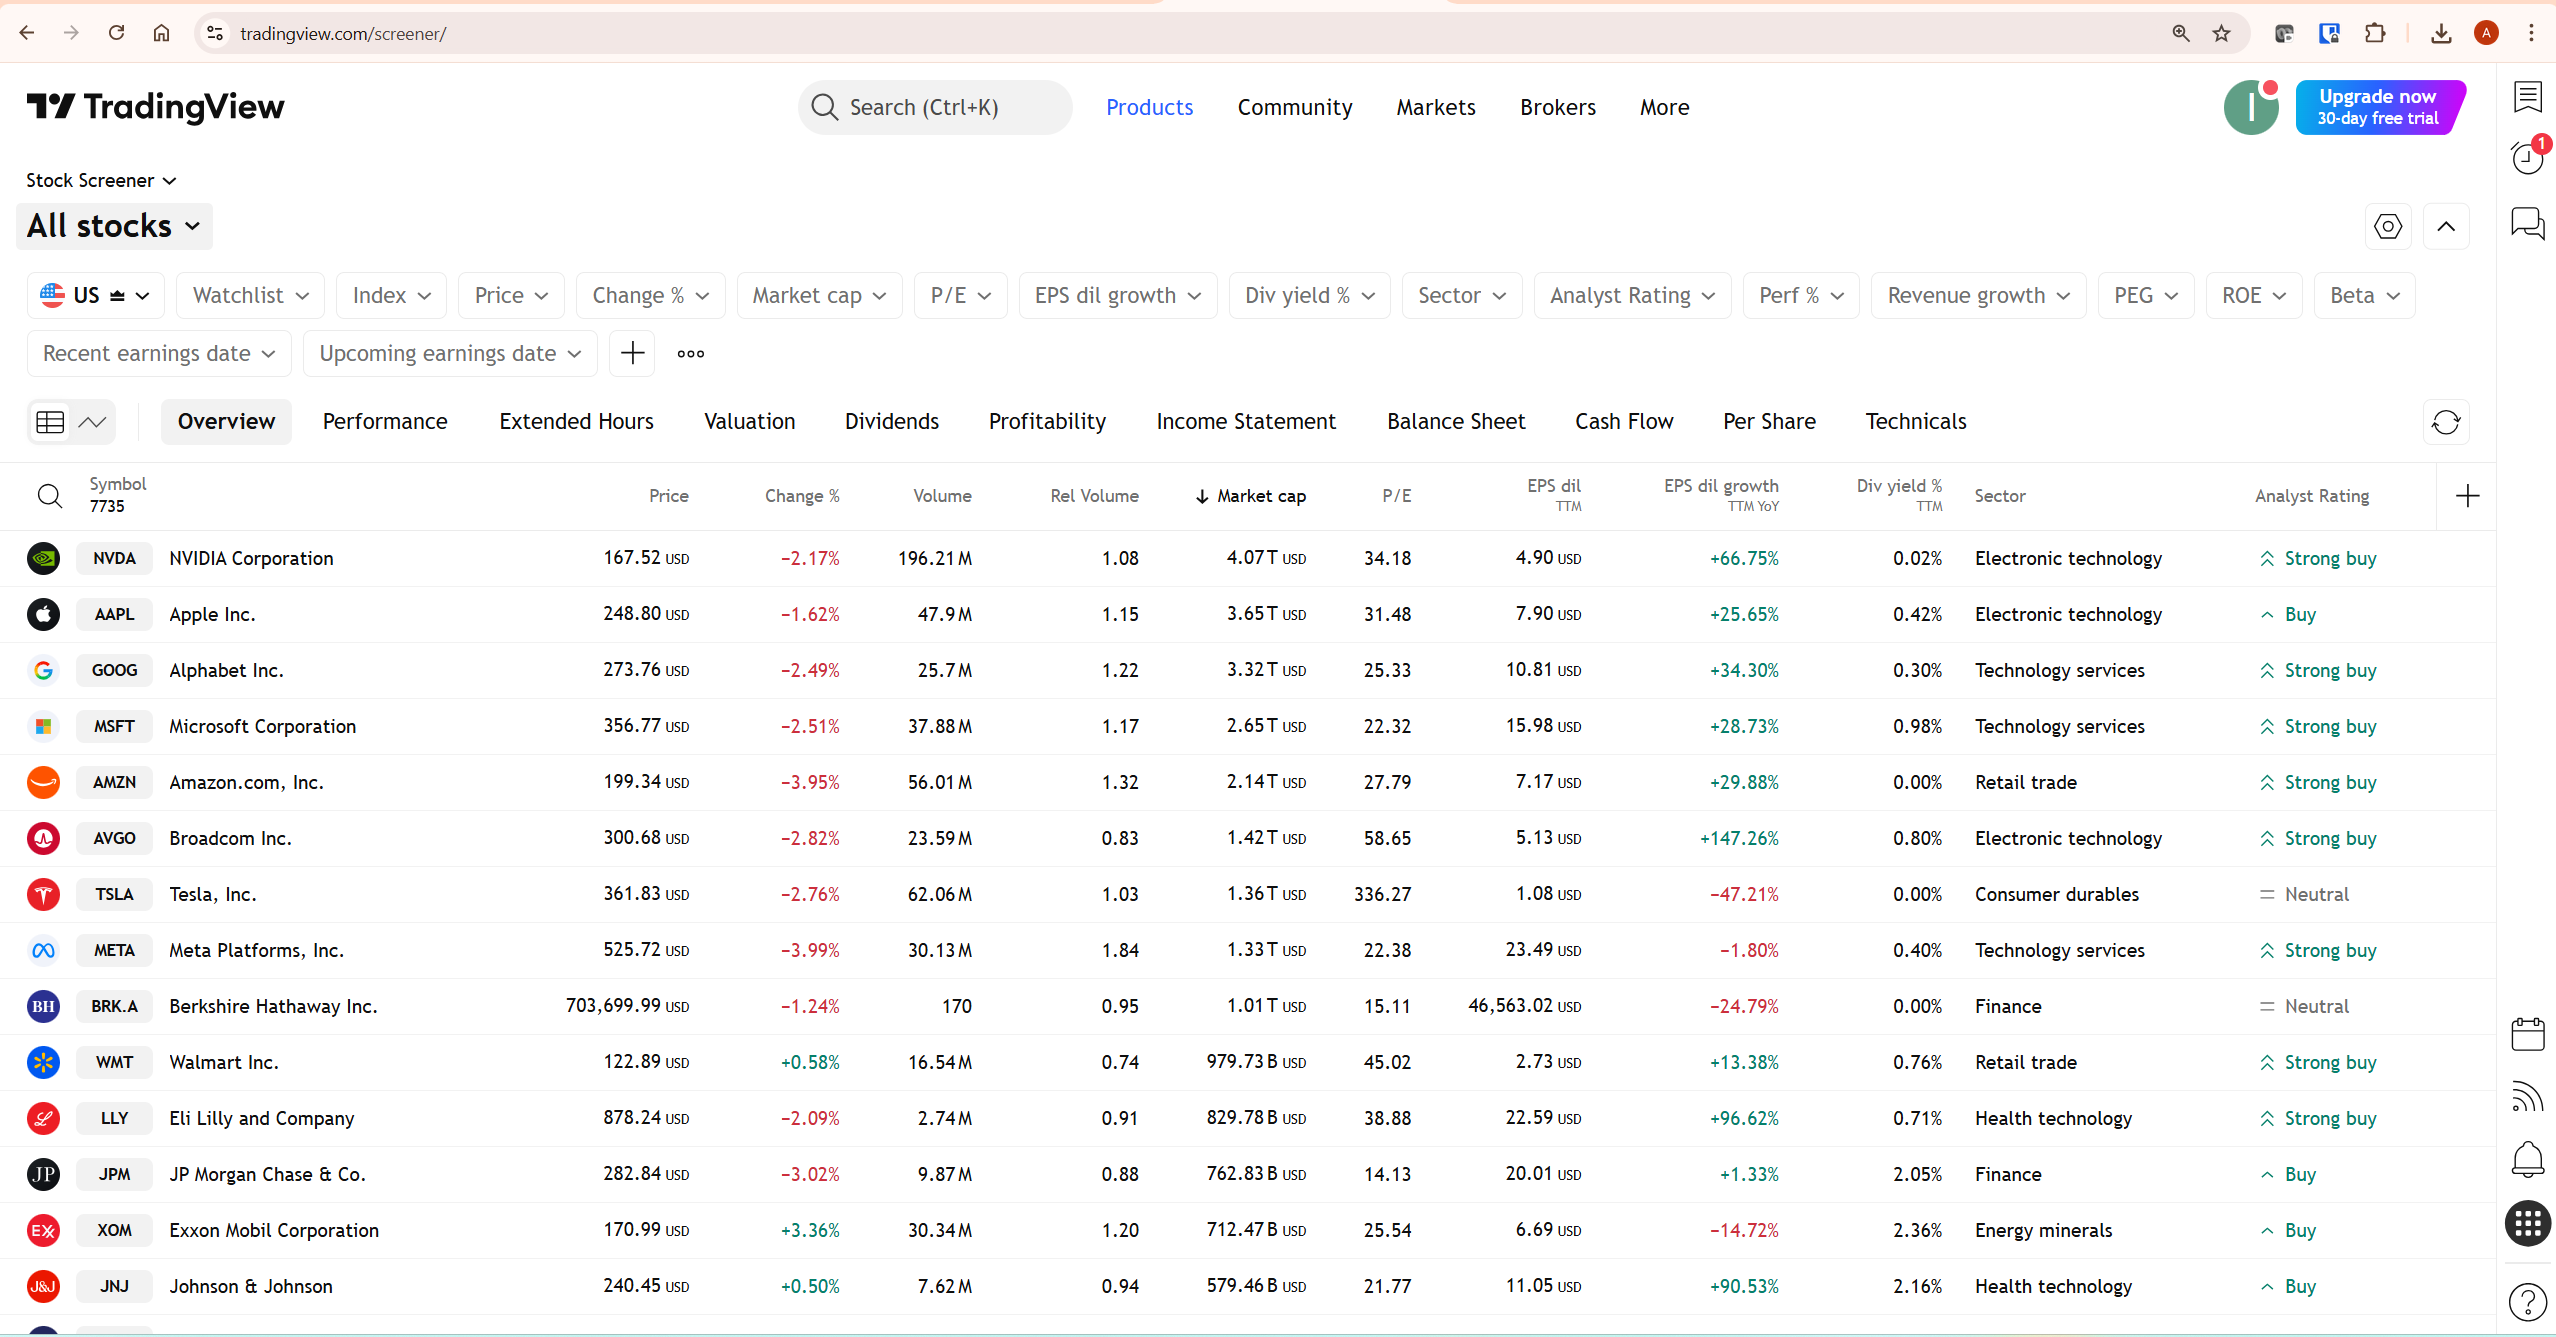
TradingView’s screener is solid and significantly improved since its 2025 redesign. It covers stocks, ETFs, crypto, forex, and bonds across global markets, and supports both technical and fundamental filters. But for pure US stock screening speed and visual efficiency, Finviz is faster and more intuitive. The heat map alone justifies bookmarking Finviz even if you never use any other feature.
One critical limitation of Finviz’s free tier: data is delayed by 15-20 minutes. For investors using Finviz to build a watchlist the evening before, this is irrelevant. For active day traders who need real-time signals, the free tier is not viable — Finviz Elite at $24.96/month on annual billing is required to unlock real-time data. This is one of the most important practical details in any tradingview vs finviz comparison and one that most articles mention too briefly. For our full guide to screener workflows, our TradingView screener guide covers the complete technical filtering process.
TradingView vs Finviz for Crypto Trading
For crypto traders, the tradingview vs finviz comparison is not close — TradingView wins comprehensively and Finviz adds minimal value to a crypto-focused workflow.
TradingView covers over 2,800 cryptocurrency instruments across every major exchange — Binance, Coinbase, Kraken, OKX, Bybit, and more. You can chart any pair with full indicator support, multi-timeframe analysis, real-time alerts, and the dedicated Crypto Coins Screener. The screener covers market cap, volume, social dominance, technical rating, and category filters across the entire crypto universe simultaneously.
Finviz’s crypto coverage is minimal by comparison. The platform offers a basic crypto overview page showing major tokens — Bitcoin, Ethereum, and a small selection of others — with delayed price data and simple performance metrics. There are no crypto-specific screener filters, no technical indicator support for crypto charts, and no crypto heat map equivalent. Finviz was built for US equities and it shows — crypto is a secondary feature added to avoid appearing limited, not a genuine capability.
The verdict for crypto traders: use TradingView for all analysis and ignore Finviz entirely unless you also trade US stocks. For a practical guide to using TradingView’s full crypto toolkit, our guide to using TradingView for crypto trading covers the complete workflow from chart setup to alert configuration.
Pricing: What You Actually Get at Each Tier
Pricing in the tradingview vs finviz comparison is deceptively simple — both have strong free tiers, but the free tier limitations are fundamentally different in nature.
| Plan | TradingView | Finviz |
|---|---|---|
| Free | Real-time charts, 2 indicators, 3 alerts, 1 chart layout, ads | Delayed data (15-20 min), basic screener, heat maps, ads |
| Entry paid | Essential — $12.95/month (annual) | Elite — $24.96/month (annual) |
| Entry paid unlocks | 5 indicators, 20 alerts, Bar Replay, ad-free, Volume Profile | Real-time data, advanced charts, backtesting, alerts, API |
| Free trial | 30 days — no credit card | 7 days — credit card required |
| Money-back guarantee | No | 30 days on monthly plan |
| Best free tier for | Charting and technical analysis | Stock screening and market overview |
TradingView’s free tier offers real-time data on most markets — a genuinely meaningful advantage over Finviz’s 15-20 minute delay. Finviz’s free tier offers a more powerful screener than TradingView’s free screener — but at the cost of working with delayed data.
The most cost-effective professional setup for US stock traders is Finviz free combined with TradingView Essential at $12.95/month. This gives you real-time screening on Finviz for morning market scans alongside full TradingView charting with indicators, alerts, and Bar Replay. Total cost: $12.95/month — significantly less than Finviz Elite alone at $24.96/month. For a complete breakdown of what each TradingView plan includes, our TradingView free vs paid guide covers every tier in detail.
The Combined Workflow: Using TradingView and Finviz Together
The most practical resolution to the tradingview vs finviz question for US stock traders is not a choice between them — it is a workflow that uses each platform for what it does best. Here is exactly how that works in practice.
Morning market overview — Finviz heat map (5 minutes): Open Finviz’s heat map at finviz.com/map.ashx before markets open. Identify which sectors are showing pre-market strength or weakness. This top-down context shapes the bias you bring to your chart analysis for the session — are you looking for long setups in leading sectors or defensive positioning in lagging ones?
Candidate screening — Finviz screener (10 minutes): Run your saved screener filter on Finviz to generate a list of stocks meeting your criteria for the session. With the free tier and morning pre-market context, this produces a shortlist of ten to twenty candidates worth charting. For active day traders who need real-time data at this stage, Finviz Elite’s data feed is required.
Chart analysis — TradingView (main session): Add your Finviz candidates to a TradingView watchlist and work through them systematically. Apply your full indicator setup, check multiple timeframes, set alerts on key levels. TradingView’s charting depth is where the trading decision actually gets made — Finviz gave you the candidates, TradingView tells you whether and how to trade them.
This workflow costs nothing beyond TradingView Essential at $12.95/month if you use Finviz free. It is how many professional retail traders operate, and it is more systematic than relying on either platform alone.
Honest Limitations of Each Platform
No tradingview vs finviz comparison is complete without acknowledging what each platform does poorly.
TradingView’s honest limitations: the free plan’s two-indicator limit and three-alert cap make it genuinely restrictive for active traders. Paid plan pricing increased approximately 13% in 2025. The screener, while capable, is slower and less visual than Finviz for US stock scanning. TradingView has no fundamental data depth comparable to what Finviz provides on insider trading, institutional holdings, and earnings metrics.
Finviz’s honest limitations are more significant for most traders. The 15-20 minute free data delay makes it unusable as a real-time trading tool without Elite. There is no mobile app — the platform is web-only, which is a meaningful gap in 2026 when most traders monitor markets from multiple devices. Finviz has no community features, no shared ideas, and no social component. Its crypto coverage is superficial. And its charts, even on Elite, remain non-interactive compared to any dedicated charting platform.
Who Should Use Which Platform
Use TradingView only if: you are a crypto trader, a forex trader, or a futures trader — Finviz adds nothing meaningful to these workflows. TradingView covers every market you trade with superior data and charting tools. Also use TradingView only if your trading is entirely chart-based with no fundamental screening component.
Use Finviz only if: you are a casual US stock investor who checks markets occasionally, needs a quick visual overview of sector performance, and does not require real-time data or advanced charting. The free tier is excellent for this use case.
Use both together if: you are an active US stock or ETF trader who starts each session with a market overview and candidate scan before moving to chart analysis. This is the highest-value setup and the one that makes the tradingview vs finviz question irrelevant — they serve different stages of the same workflow.
What to Do Next
If you trade US stocks, open finviz.com right now and bookmark the heat map at finviz.com/map.ashx. Use it for five minutes tomorrow morning before markets open. If it changes how you think about the session’s bias, you have your answer about whether Finviz belongs in your workflow — at zero cost.
If you are not yet using TradingView as your primary charting platform, start a free 30-day trial through our TradingView affiliate link. The Essential plan at $12.95/month unlocks everything most active traders actually need — indicators, alerts, Bar Replay, and Volume Profile. No credit card required for the trial.
Frequently Asked Questions
Is TradingView better than Finviz?
For charting, technical analysis, crypto coverage, and alerts, TradingView is significantly better. For fast US stock screening and sector heat maps, Finviz is the stronger tool. The tradingview vs finviz comparison is most useful when you understand that both platforms excel at different stages of the trading process — screening versus analysis — rather than competing directly.
Is Finviz free to use?
Yes — Finviz’s screener, heat maps, charts, and news feed are all available without registration or payment. The critical limitation is that free data is delayed by 15-20 minutes for most markets. For active traders who need real-time signals, Finviz Elite at $24.96/month (annual billing) is required. The 7-day free trial of Elite requires a credit card but can be cancelled before the trial ends.
Can you use TradingView and Finviz together?
Yes — and for US stock traders this is the recommended approach. Use Finviz for morning market overview and candidate screening, then use TradingView for chart analysis and trade planning on the candidates Finviz identifies. Finviz free combined with TradingView Essential at $12.95/month costs less than Finviz Elite alone and delivers more analytical capability overall.
Which is better for crypto — TradingView or Finviz?
TradingView is substantially better for crypto trading. It covers over 2,800 crypto instruments across all major exchanges with full indicator support, real-time alerts, and a dedicated crypto screener. Finviz’s crypto coverage is limited to basic price overviews of major tokens with no screening capability and no interactive charting. Crypto traders should use TradingView as their primary platform and ignore Finviz for this asset class.
Does Finviz have a mobile app?
No — Finviz is web-only with no dedicated iOS or Android app as of 2026. The website is mobile-responsive and usable on a smartphone browser, but the experience is significantly less smooth than TradingView’s dedicated mobile app. For traders who monitor markets primarily from mobile devices, TradingView’s mobile app is a meaningful practical advantage in the tradingview vs finviz comparison.
What is Finviz Elite and is it worth it?
Finviz Elite costs $39.50/month or $24.96/month on annual billing. It unlocks real-time data, advanced interactive charts, backtesting on up to 20 years of historical data, custom alerts, Excel export, and API access. Elite is worth it for active US stock traders who rely on Finviz as their primary screening tool and need real-time data to function. It is harder to justify if you already use TradingView for charting — the Finviz free tier combined with TradingView Essential is a more capable and cheaper setup for most traders.
Conclusion
The tradingview vs finviz comparison resolves differently depending on what you trade. For crypto traders, TradingView is the clear answer and Finviz adds nothing meaningful to the workflow. For US stock traders, the right answer is both — Finviz free for the heat map and morning screening, TradingView for chart analysis and trade execution. That combined setup is more powerful and less expensive than paying for either platform’s premium tier alone.
TradingView is the better platform by almost every objective measure — charting depth, asset coverage, community, alerts, mobile experience. But Finviz’s heat map and screener fill a genuine gap that TradingView does not fully address, and the free tier delivers that value at no cost.
Start your TradingView free trial through our affiliate link and bookmark Finviz’s heat map alongside it. For a full review of TradingView’s capabilities beyond this comparison, our TradingView review covers the complete platform. To see how TradingView compares against other platforms, our TradingView vs Webull comparison and TradingView vs MetaTrader comparison cover the most common alternatives.
Trading involves risk. Technical analysis tools do not guarantee profitable results. Past performance is not indicative of future results. Always manage your risk appropriately.
