
TradingView Elliott Wave: Honest Complete Guide (2026)
This article contains affiliate links. If you sign up for TradingView through a link on this page, I may earn a commission at no extra cost to you. I only recommend tools I have genuinely evaluated.
Trading involves risk. Technical analysis tools do not guarantee profitable results. Past performance is not indicative of future results. Always manage your risk appropriately.
TradingView Elliott Wave tools are built directly into the platform’s drawing toolbar and available on every plan including the free Basic tier. I am Andreas Maratheftis, and after 30 years in professional finance I can tell you that Elliott Wave is one of the most misused frameworks in retail trading — not because the theory is wrong, but because most traders apply it without understanding the three non-negotiable rules that govern a valid count. This guide shows you exactly where to find the tool on TradingView, how to draw a valid five-wave impulse and ABC correction, which Fibonacci levels apply to each wave, and where the method genuinely breaks down.
Quick Answer
The Elliott Wave drawing tool is in TradingView’s left-side toolbar under the drawing tools group — look for the wave icon labelled “Elliott Wave.” It is free on all plans including Basic. The tool lets you manually label a five-wave impulse structure by clicking five points on the chart. A separate Elliott ABC Correction tool labels the three-wave corrective move that follows. TradingView does not automatically count waves for you — all wave labelling is manual. For automated wave detection, you need a community Pine Script indicator from the public library.
Open TradingView free and access the Elliott Wave drawing tool on any chart today.
What Is Elliott Wave?
The theory describes market price movement as a series of repeating wave patterns driven by collective investor psychology. The core structure consists of two phases: an impulse phase of five waves in the direction of the main trend, followed by a corrective phase of three waves against it.
The five impulse waves are labelled 1, 2, 3, 4, and 5. Waves 1, 3, and 5 move in the direction of the trend. Waves 2 and 4 are counter-trend corrections. After the five-wave impulse completes, a three-wave ABC correction follows — Wave A and C move against the prior trend, Wave B moves with it.
The practical value is a structural map of where the market may be within a larger cycle. If you can correctly identify that price is completing Wave 4, you can anticipate Wave 5 and position accordingly. The challenge — and the reason most traders struggle with it — is that wave counting is inherently subjective. Two experienced analysts will often produce different counts on the same chart. The rules exist precisely to constrain that subjectivity.
The Three Elliott Wave Rules You Must Follow
These are not guidelines — they are invalidation rules. If any one of them is broken, the wave count is wrong and must be redrawn. No exceptions.
| Rule | What It States | Why It Matters |
|---|---|---|
| Rule 1: Wave 2 cannot retrace more than 100% of Wave 1 | The low of Wave 2 must not fall below the starting point of Wave 1 | If it does, Wave 1 was not a valid impulse wave — the count must restart |
| Rule 2: Wave 3 is never the shortest impulse wave | Wave 3 must be longer than either Wave 1 or Wave 5 (or both) | Wave 3 is where the most momentum occurs — if it is the shortest, the structure is invalid |
| Rule 3: Wave 4 should not overlap Wave 1 (standard impulse) | In a standard impulse wave, Wave 4 should not enter Wave 1’s price territory | Certain diagonal structures (leading and ending diagonals) are exceptions to this rule — but in a standard impulse, overlap invalidates the count |
Before drawing any Elliott Wave count on TradingView, verify these three rules as you place each point. Most invalid counts fail on Rule 1 or Rule 3 — traders place Wave 2 too deep or allow Wave 4 to overlap Wave 1 territory.
Where to Find the Elliott Wave Tool on TradingView
The Elliott Wave tool is in the left-side drawing toolbar — the vertical panel on the left edge of every TradingView chart. It sits within the pattern and measurement tools group.
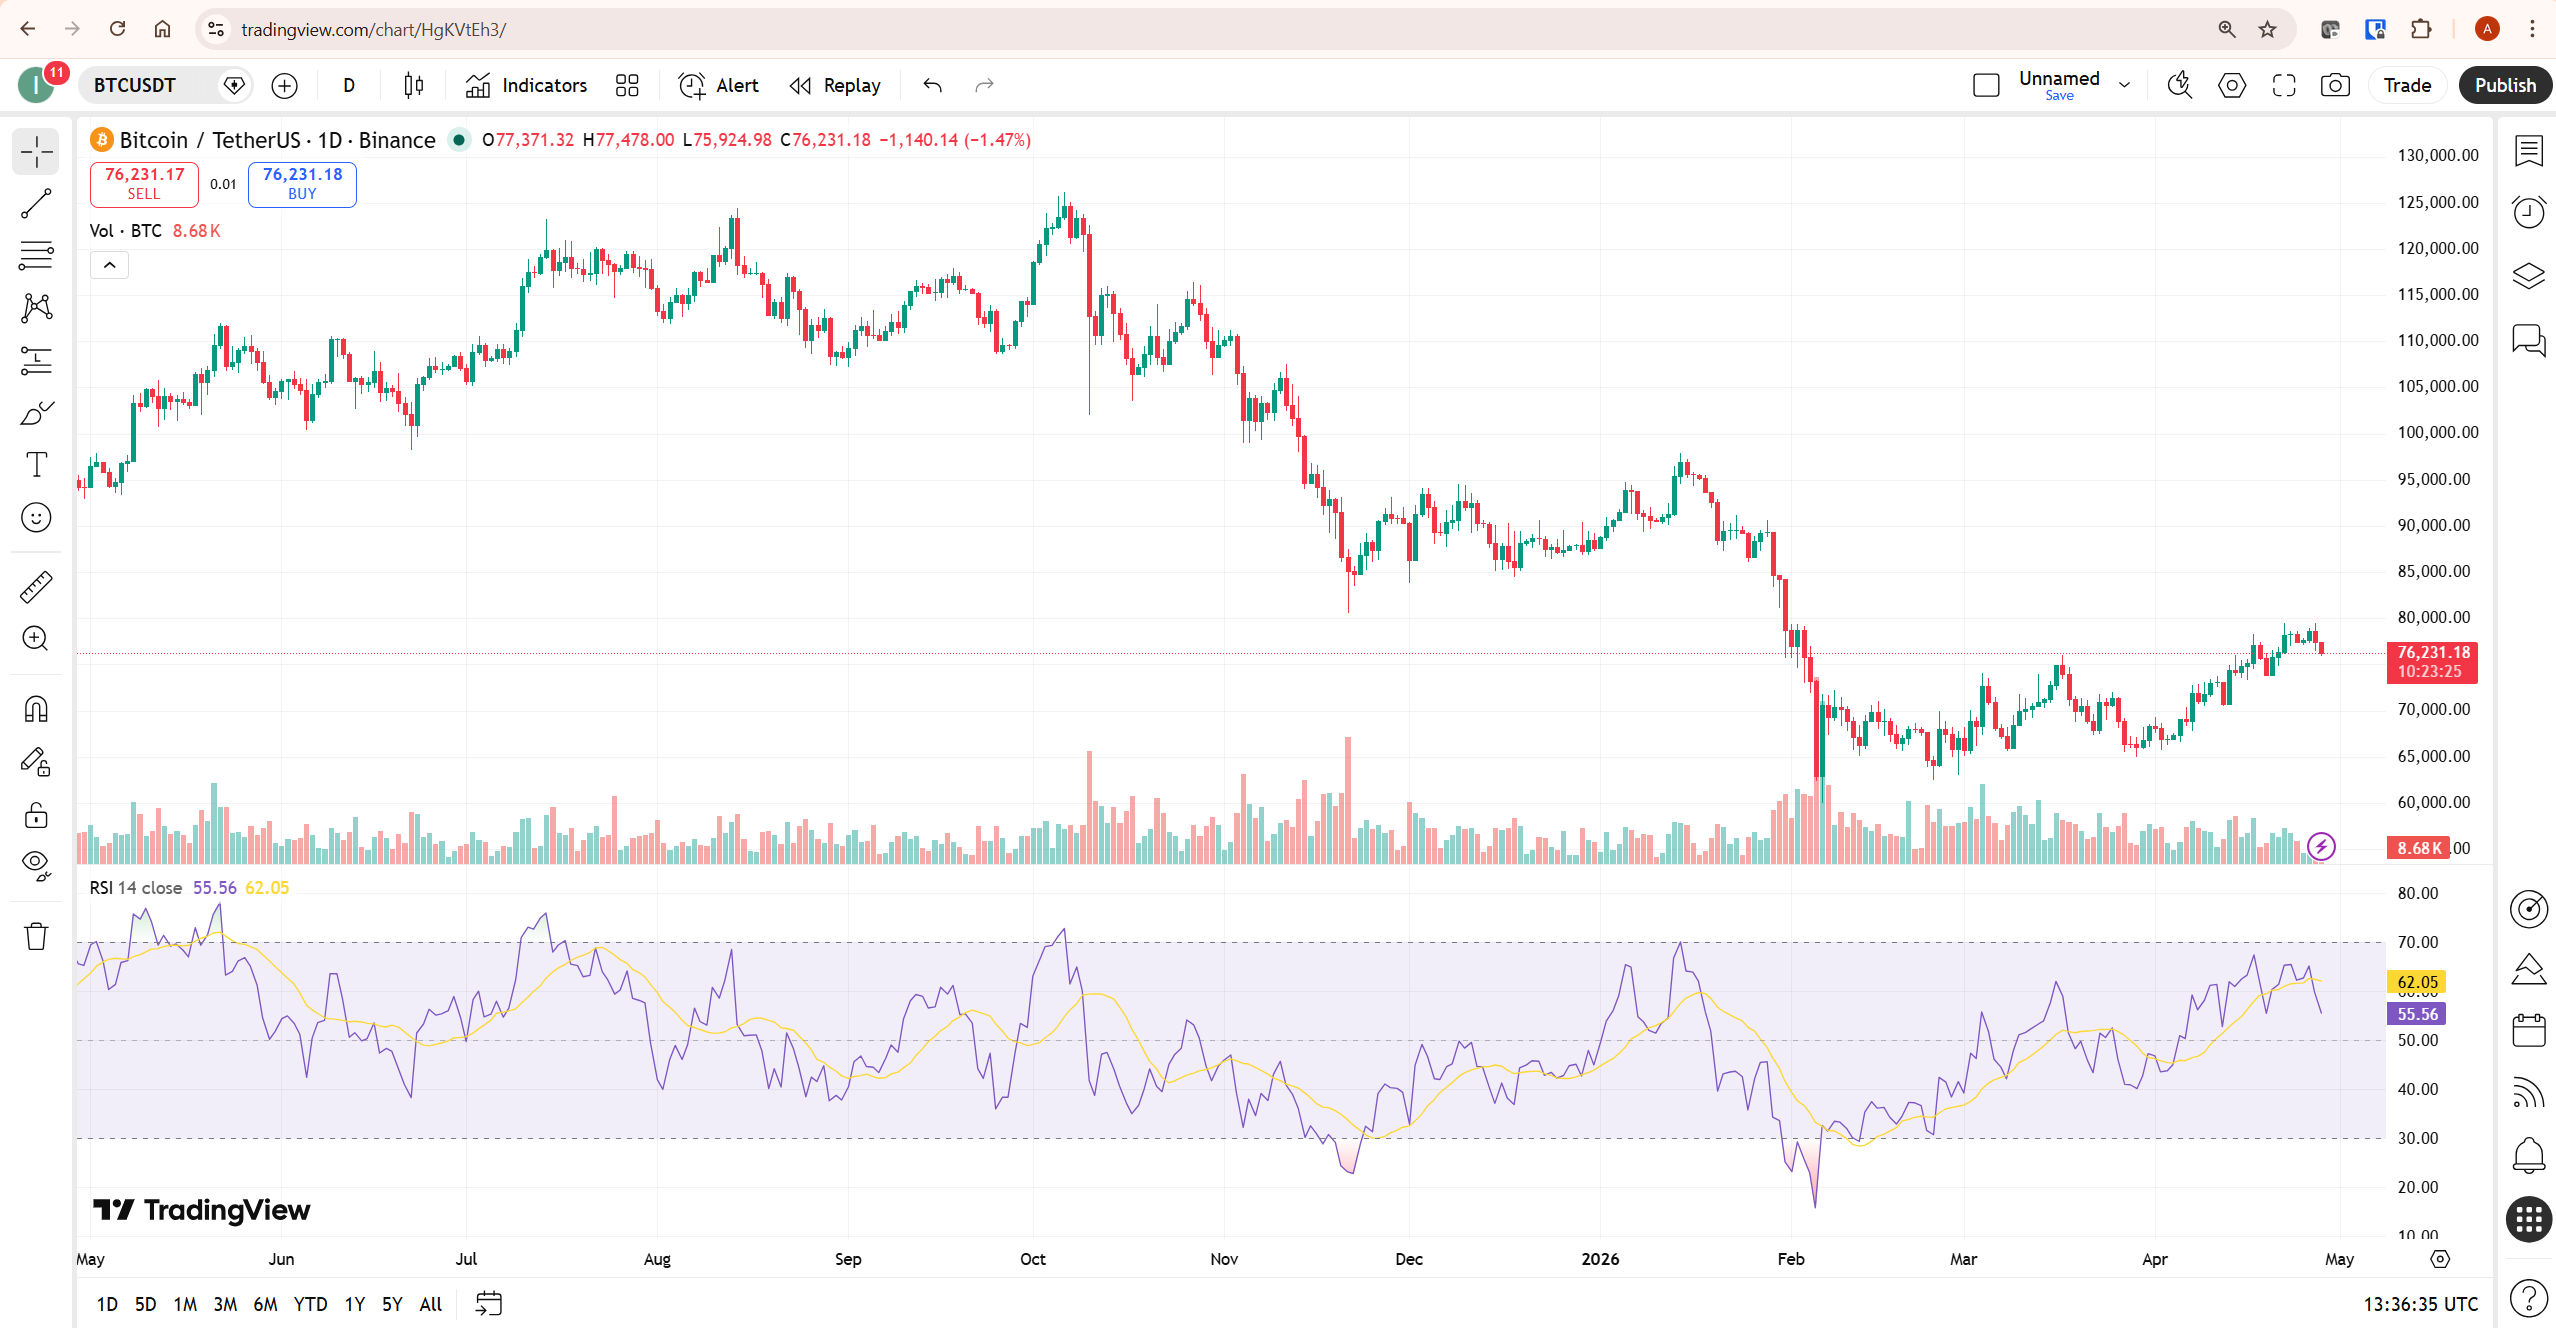
If you cannot see the Elliott Wave icon immediately, hover over the toolbar icons — each group expands to show additional tools. You are looking for the wave icon; its tooltip reads “Elliott Wave.” On the same toolbar you will also find the Elliott ABC Correction tool for labelling the three-wave corrective structure.
Both tools are available on all plans including the free Basic tier. You do not need a paid subscription to draw Elliott Wave counts on TradingView. Create a free TradingView account to access the Elliott Wave and Fibonacci tools on any chart.
How to Draw Elliott Wave on TradingView: Step by Step
The following process draws a complete five-wave impulse structure. Work on a daily or weekly chart when learning — shorter timeframes produce noisier wave structures that are harder to count correctly.
- Select the Elliott Wave tool from the left toolbar. Your cursor changes to a crosshair.
- Click the start of Wave 1 — the clear low where the impulse move begins. This is the origin point of the entire structure.
- Click the peak of Wave 1 — the high point before the first pullback begins.
- Click the low of Wave 2 — the end of the first corrective pullback. Verify Rule 1: this point must be above the Wave 1 start.
- Click the peak of Wave 3 — the high point of the strongest impulse move. This is typically the most extended wave. Verify Rule 2: Wave 3 must be longer than Wave 1.
- Click the low of Wave 4 — the second corrective pullback. Verify Rule 3: this point must not enter Wave 1’s price territory.
- Click the peak of Wave 5 — the final push in the direction of the trend. The five-wave structure is now complete.
TradingView automatically labels each point 1 through 5 and draws connecting lines between them. You can drag any point after placement to adjust the count without starting over.
After completing the five-wave impulse, select the Elliott ABC Correction tool and draw the three-wave corrective structure that follows: Wave A (the initial move against the trend), Wave B (the counter-rally), and Wave C (the final corrective leg). Wave C frequently equals Wave A in length — a useful projection target.
Elliott Wave and Fibonacci: The Essential Combination
Elliott Wave theory and Fibonacci ratios are inseparable in practice. The Fibonacci levels predict where each wave is likely to end, giving you price targets and invalidation levels before the wave completes. Used together, they transform a subjective wave count into a measurable framework.
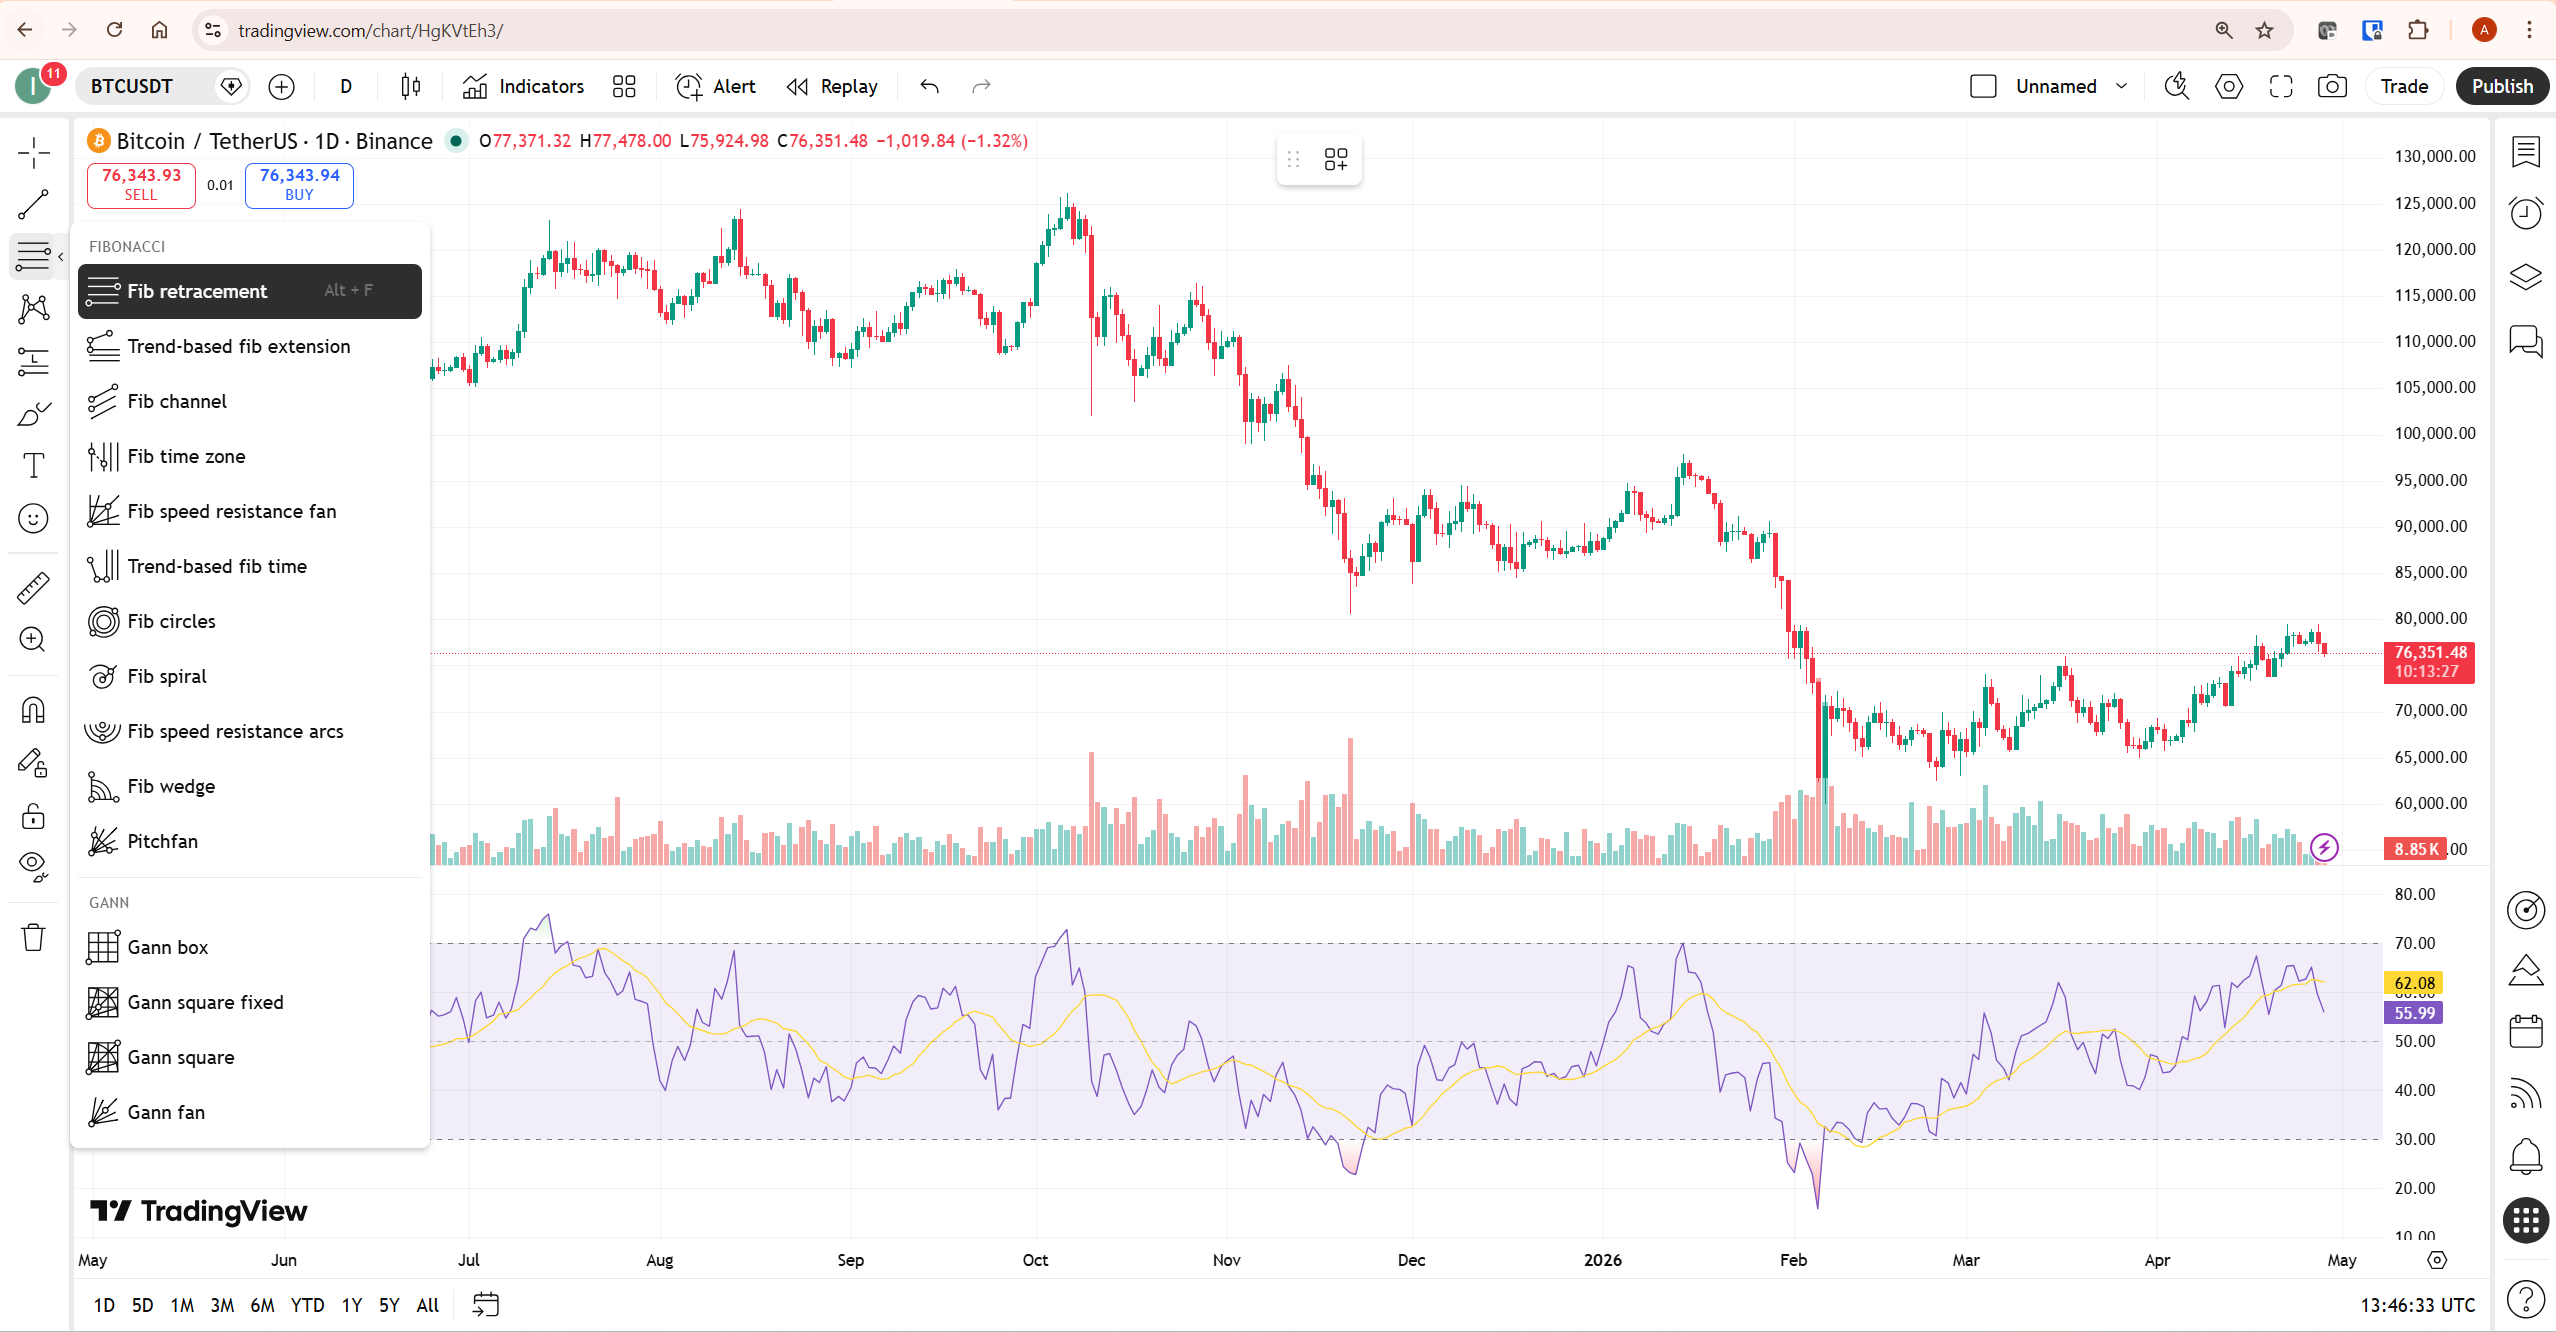
Here are the Fibonacci relationships that appear most consistently across wave structures:
| Wave | Fibonacci Relationship | How to Apply in TradingView |
|---|---|---|
| Wave 2 | Retraces 38.2%–78.6% of Wave 1. Most common: 50% and 61.8% | Draw Fibonacci retracement from Wave 1 start to Wave 1 peak — the 61.8% level is your primary Wave 2 target |
| Wave 3 | Extends 1.618× to 2.618× the length of Wave 1. Most common: 1.618× | Draw Fibonacci extension from Wave 1 start through Wave 1 peak, anchored at Wave 2 low — the 161.8% level is your primary Wave 3 target |
| Wave 4 | Retraces 23.6%–38.2% of Wave 3. Shallower than Wave 2 | Draw Fibonacci retracement from Wave 3 start to Wave 3 peak — the 38.2% level is your primary Wave 4 target |
| Wave 5 | Often equals Wave 1 in length, or extends to 0.618× Wave 1 | Measure Wave 1 length and project it from the Wave 4 low |
| Wave C | Frequently equals Wave A in length, or extends to 1.618× Wave A | Measure Wave A length and project from Wave B peak |
In TradingView, the Fibonacci retracement and extension tools are in the same left toolbar as the Elliott Wave tool. Draw the Fibonacci levels on the same chart as your wave count — when a wave reaches a key Fibonacci level and price action confirms a reversal, that confluence is your entry signal. Neither the Fibonacci level nor the wave count alone is sufficient — you need both.
For a complete guide to all of TradingView’s drawing tools, see our TradingView Drawing Tools guide.
Elliott Wave Indicators on TradingView: Automated vs Manual
TradingView’s built-in Elliott Wave tool is manual — you place every point yourself. This is intentional. Wave counting requires judgment that no algorithm replicates reliably, and any tool that claims to automatically count waves is producing one possible count among several valid alternatives.
That said, the TradingView public library contains hundreds of community-published Pine Script Elliott Wave indicators. Some of the most widely used approaches include automated pivot detection to identify potential wave points, Fibonacci validation overlays that flag whether a count meets the three core rules, and probability-weighted wave projections that show multiple competing counts simultaneously.
The most useful approach is to use the manual drawing tool to establish your primary count, then add one community indicator as a cross-check — not as a replacement for your own analysis. When the automated indicator’s count aligns with yours, that confluence increases your confidence. When they diverge, that is a signal to reassess rather than an automatic override of either view.
To find Elliott Wave indicators: click the Indicators button in the top toolbar, type “elliott wave” in the search box, and filter by Community Scripts. Sort by Most Used to see the most widely adopted indicators. Always read the script description carefully — good Elliott Wave indicators are transparent about their limitations and do not claim to produce guaranteed counts.
For context on how TradingView’s indicator system works alongside drawing tools, see our TradingView Review.
Elliott Wave on Crypto vs Stocks vs Forex
Elliott Wave works across all asset classes available on TradingView, but its reliability varies significantly by market.
Crypto is where Elliott Wave has the most active community on TradingView, and for understandable reasons — Many Elliott Wave practitioners find Bitcoin’s higher-timeframe cycles easier to analyse because long-term trend phases often produce recognisable impulse and corrective structures on weekly and monthly charts. Wave 4 overlap violations are more common in crypto than in equities because of liquidation cascades, but the overall framework applies well to Bitcoin’s major cycle counts.
Stocks and indices are where the classical rules apply most cleanly. The S&P 500 and major indices have well-documented long-term Elliott Wave counts that institutional analysts track. For individual stocks, wave counting is more challenging because company-specific news can invalidate a count regardless of the technical structure.
Forex requires more attention to the Wave 4 overlap rule — currency pairs have frequent small overlaps that would technically invalidate a count on equities but are accepted in forex analysis as “running corrections.” Most experienced forex wave analysts apply the rules with a degree of flexibility that reflects the market’s 24-hour, bank-driven nature.
The Wave Channel: Projecting Wave 5
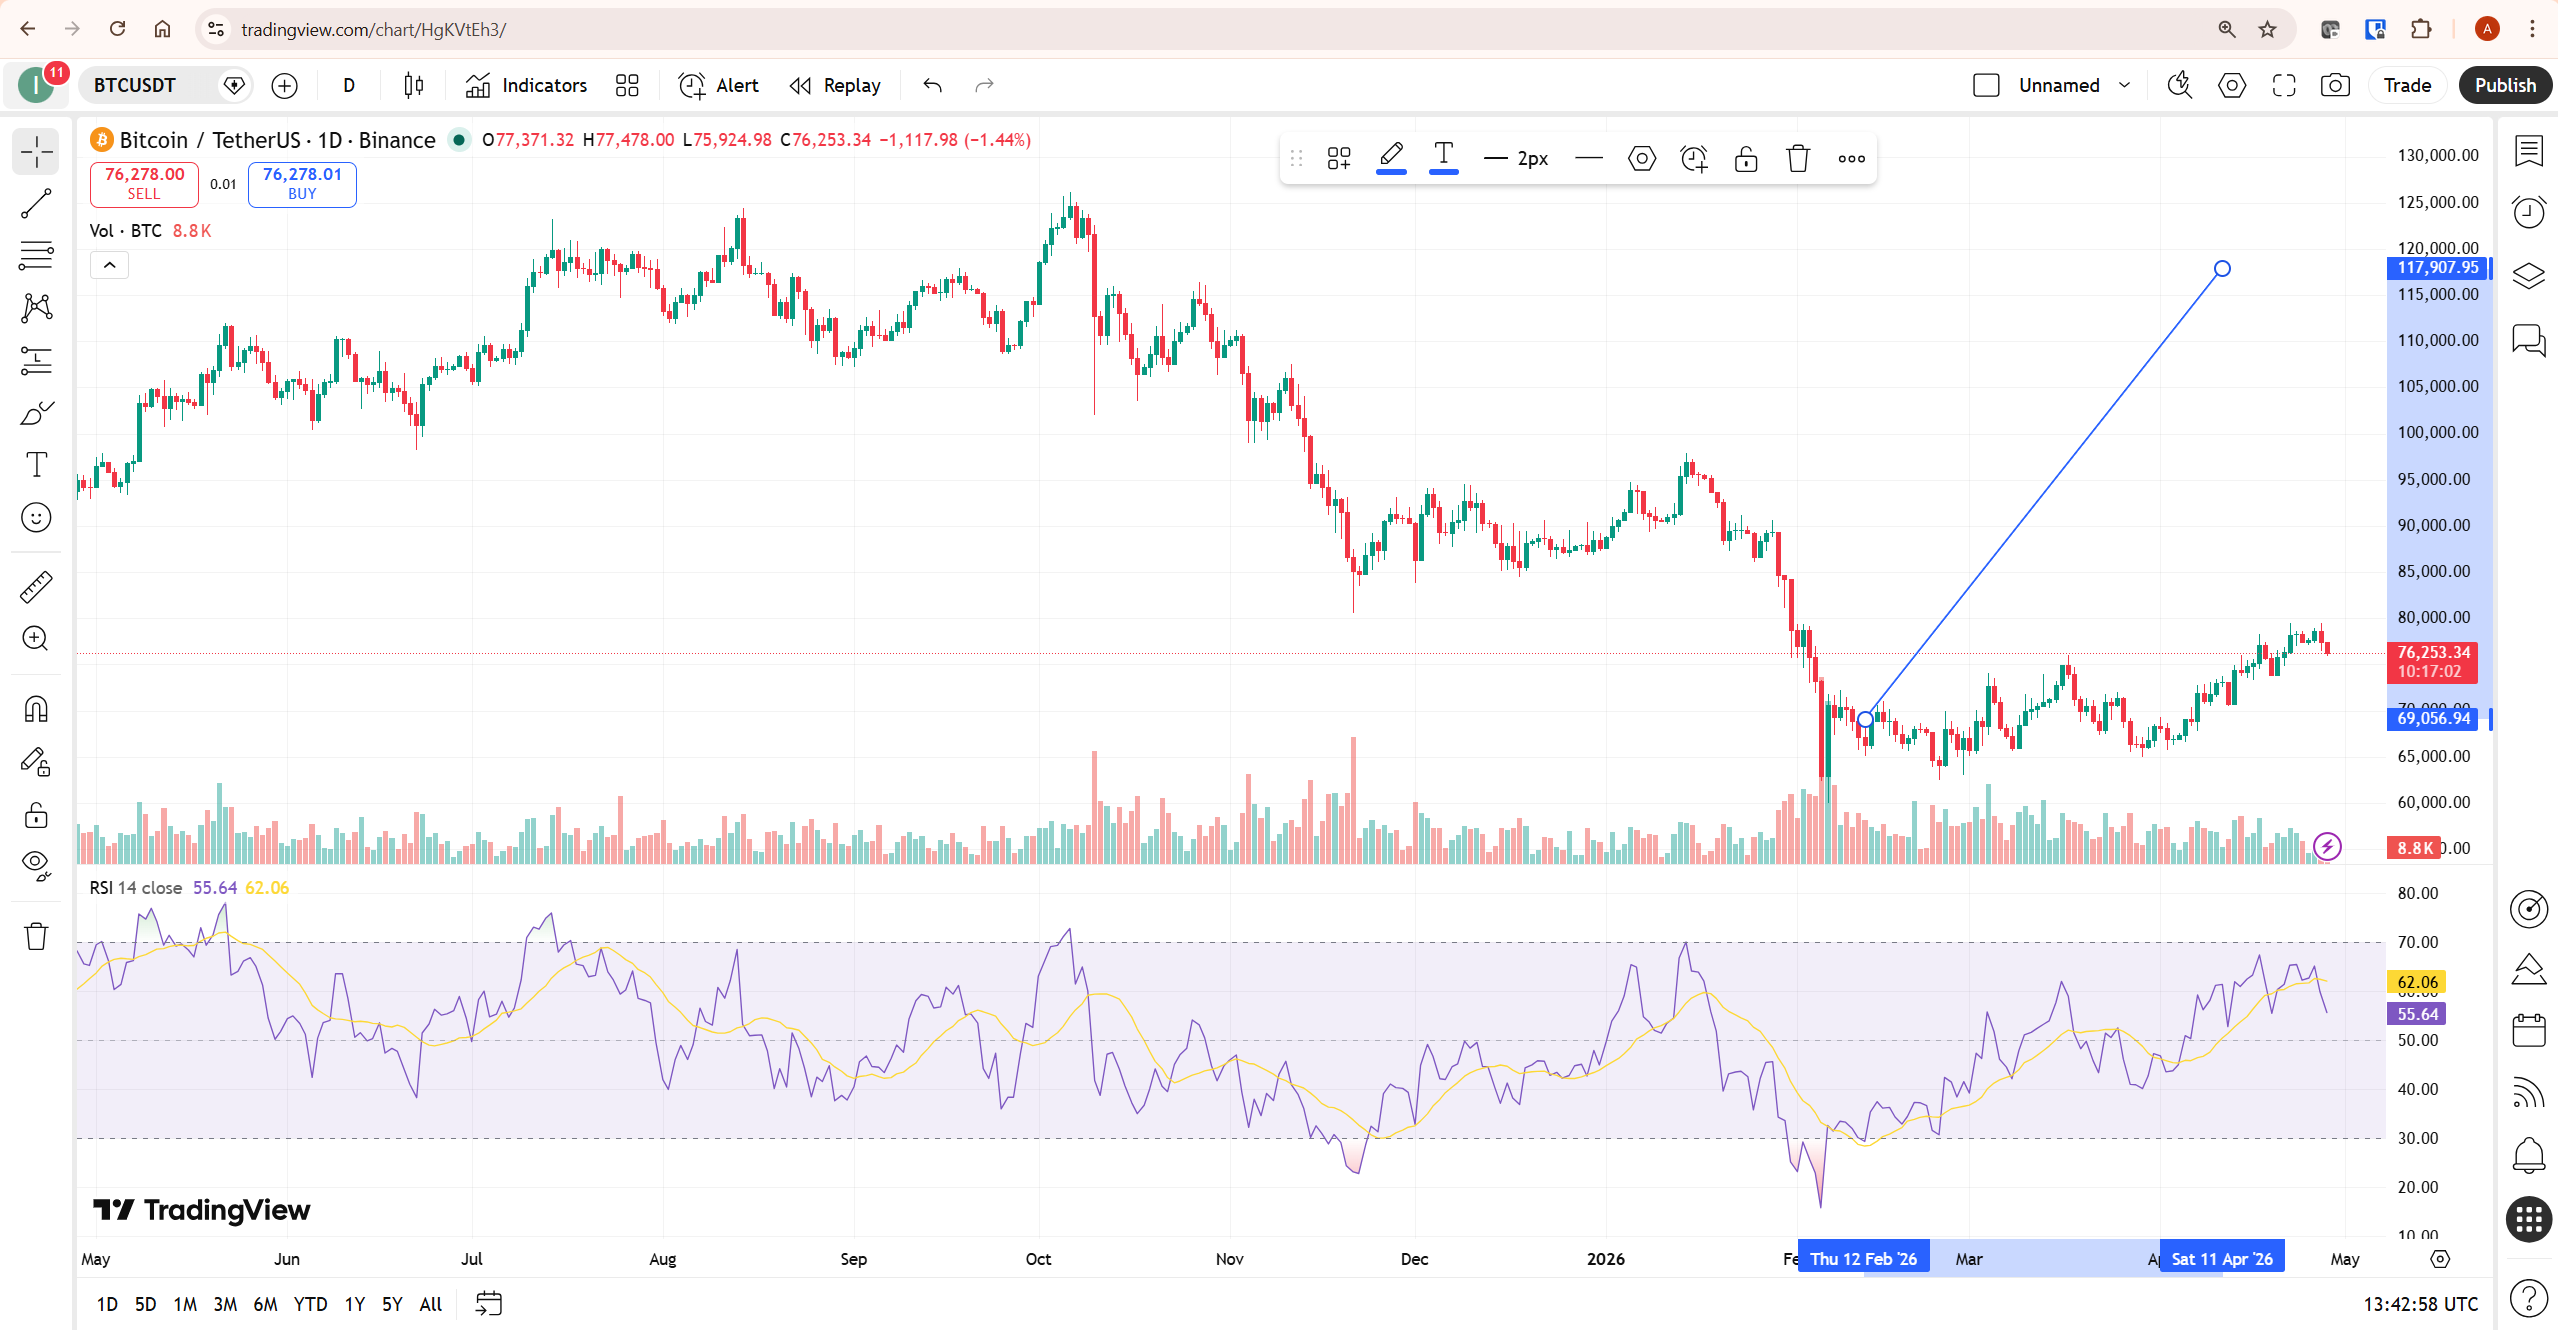
One of the most practical applications of Elliott Wave on TradingView is the channel technique for projecting Wave 5. Once Waves 1 through 4 are complete, draw a trendline connecting the peaks of Waves 1 and 3. Then draw a parallel line from the low of Wave 2. The upper channel line — drawn from the Wave 1 peak through the Wave 3 peak — provides a projection target for Wave 5.
In TradingView, use the Parallel Channel tool (also in the left toolbar) to draw this projection cleanly. Set your first line across the Wave 2 and Wave 4 lows, then drag the parallel line to touch the Wave 3 peak. The upper boundary of this channel is your Wave 5 projection target. Wave 5 often terminates at or near the upper channel line, though extensions are common — Wave 5 can overshoot the channel in strong trending markets.
This channel technique gives you a specific price zone to watch before Wave 5 completes — when you would expect the ABC correction to begin. Channel projections are guidelines rather than exact targets — Wave 5 may terminate before reaching the channel boundary or extend beyond it. Set a TradingView alert at the upper channel boundary to be notified when price approaches the projected Wave 5 termination area. See our TradingView Alerts guide for the exact setup process.
Common Elliott Wave Mistakes on TradingView
The most common mistake is forcing a wave count to fit a desired trade. If you want to buy, you will find a way to label the current structure as Wave 2 or Wave 4 regardless of whether it actually is. The analysis requires you to start with the chart and let the count emerge from the price structure — not the other way around.
The second mistake is starting the count on too short a timeframe. A wave count on a 5-minute chart is influenced by every piece of noise in the market. Start on the weekly or daily chart to establish the primary trend direction and major wave structure, then drill down to a shorter timeframe only for entry timing within a wave you have already identified on the higher timeframe.
The third mistake is treating a single Fibonacci confluence as confirmation. One Fibonacci level aligning with a wave endpoint is interesting. Two or three Fibonacci levels from different measurements converging at the same price zone is meaningful confluence. Train yourself to look for multiple Fibonacci overlaps before committing to any wave endpoint.
The fourth mistake is not tracking your counts. TradingView allows you to save chart layouts with your wave count preserved. Save your count, set alerts at the key levels, and review the chart daily. When price invalidates your count — which it will, regularly — note why and redraw. The discipline of tracking and reviewing counts is how wave analysis improves over time.
Honest Limitation: What Elliott Wave Cannot Do
This is a framework for organising price history into a structural narrative. It is not a predictive system with defined outcomes. Two skilled analysts will often produce different valid counts on the same chart — both technically correct, both pointing to different conclusions. This ambiguity is not a flaw in the theory; it is an inherent property of any framework applied to a complex adaptive system like a financial market.
The practical limitation for TradingView users is this: wave counts on lower timeframes are frequently invalidated by news events, liquidity shifts, and market microstructure that has nothing to do with the wave structure you drew. On a 15-minute crypto chart, a single large liquidation event can reset an entire wave count. On a daily equity chart, an earnings surprise does the same.
The correct use of Elliott Wave is as one input among several — not as a standalone trading system. Combine your wave count with volume analysis, key support and resistance levels, and at least one momentum indicator. When all three align with your wave count, confidence increases. When they diverge, the wave count should yield to the weight of evidence from the other inputs.
For external perspective on how Elliott Wave Theory works in practice, Investopedia covers the foundational concepts and debates around the method clearly. BabyPips also has a useful introductory guide to Elliott Wave for traders new to the framework.
What To Do Next
Open TradingView, select Bitcoin or the S&P 500 on a weekly chart, and draw your first Elliott Wave count using the tool in the left toolbar. Do not trade off it. Spend two weeks observing how price behaves relative to your count — where it respects your Fibonacci levels, where it violates your rules, and where your count needs to be redrawn. That observation period will teach you more about wave counting than any guide can.
Related TradingView Guides
- TradingView Drawing Tools — complete guide to every tool in the left toolbar including Fibonacci, channels, and pattern tools
- TradingView Alerts Explained — how to set alerts at your wave projection levels
- TradingView Volume Profile — combine volume structure with wave counts for stronger confluence
- TradingView Strategy Tester — backtest Elliott Wave-based strategies using Pine Script
- TradingView Review — complete platform overview
Frequently Asked Questions
Is Elliott Wave reliable?
Elliott Wave is a useful framework for organising price structure, but it is not a reliable standalone trading system. Its primary limitation is subjectivity — the same chart can support multiple valid counts simultaneously. Skilled analysts regularly disagree on the correct count. It is most useful when combined with other technical tools: volume analysis, Fibonacci confluence, and momentum indicators. When multiple analytical inputs align with a wave count, the probability of the count being correct increases. Used alone, Elliott Wave should be treated as context rather than signal.
How do I draw Elliott Wave on TradingView?
Open any chart on TradingView and look for the Elliott Wave icon in the left-side drawing toolbar. Click it, then click five points on the chart corresponding to the start of Wave 1, peak of Wave 1, low of Wave 2, peak of Wave 3, low of Wave 4, and peak of Wave 5. TradingView automatically labels each point and connects them. Use the separate Elliott ABC Correction tool to label the three-wave corrective structure that follows the five-wave impulse.
Is Elliott Wave free on TradingView?
Yes. The built-in Elliott Wave drawing tool is available on all plans including the free Basic tier. You can draw both the five-wave impulse and the ABC correction without a paid subscription. Community Pine Script Elliott Wave indicators from the public library are also available on all plans, though some advanced paid indicators in the community require a purchase from the script author.
Does TradingView auto-label Elliott Waves?
No. TradingView’s built-in Elliott Wave tool requires you to manually place each wave point. The platform labels the points you click but does not automatically detect or count waves. Automated wave detection is available through community Pine Script indicators in the public library — search “elliott wave” in the Indicators menu to find options. These indicators vary significantly in quality; the best ones present multiple competing counts rather than asserting one definitive label.
What are the three Elliott Wave rules?
The three rules are: Wave 2 cannot retrace more than 100% of Wave 1; Wave 3 is never the shortest of the three impulse waves; and In a standard impulse, Wave 4 should not overlap Wave 1’s price territory — the recognised exceptions are diagonal structures (leading and ending diagonals), not asset classes. These are invalidation rules for standard impulses — if violated outside a diagonal structure, the count is incorrect and must be redrawn.
What Fibonacci levels work best with Elliott Wave?
The most consistent relationships are: Wave 2 retraces 38.2%–78.6% of Wave 1 (most common at 61.8%); Wave 3 extends to 1.618× Wave 1 from the Wave 2 low; Wave 4 retraces 23.6%–38.2% of Wave 3; Wave C frequently equals Wave A in length. These are tendencies, not certainties — the value of Fibonacci in Elliott Wave analysis is identifying convergence zones where multiple Fibonacci measurements from different waves point to the same price level.
What is the best Elliott Wave indicator on TradingView?
There is no single best indicator — the most useful approach is combining the built-in manual drawing tool with one cross-checking Pine Script indicator from the community library. Search “elliott wave” in the Indicators menu and sort by Most Used. Indicators that present multiple competing counts rather than one definitive label tend to be more useful because they reflect the inherent ambiguity of wave counting rather than overstating their precision. Always read the script’s description and check how recently it was updated before relying on it.
Trading disclaimer: Trading involves risk. Technical analysis tools including Elliott Wave do not guarantee profitable results. Past performance is not indicative of future results. Always manage your risk appropriately.
