
TradingView Supertrend: Honest Settings Guide (2026)
Affiliate Disclosure: This article contains affiliate links. If you sign up for TradingView through a link on this page, I may earn a commission at no extra cost to you. I only recommend tools I have researched and believe are relevant to the reader’s use case.
Trading involves risk. This article is for educational purposes only and is not financial advice. Technical analysis tools do not guarantee profitable results. Past performance is not indicative of future results. Always manage your risk appropriately.
Last verified: August 2026, using TradingView’s official documentation and indicator library.
TradingView Supertrend is one of the cleanest trend-following indicators available on the platform, and it is free on every plan including Basic. I am Andreas Maratheftis, and after 30 years in professional finance I can tell you that Supertrend’s biggest strength — its simplicity — is also its biggest trap. Traders add it, see the clean green and red bands, and assume it will keep them on the right side of every trend. It will not. This guide covers exactly how to add Supertrend on TradingView, the formula behind it, the settings worth adjusting for different timeframes and assets, and the honest limitation that catches almost everyone who relies on it alone.
Key Takeaways
- Supertrend is a free, built-in TradingView indicator using ATR to plot a dynamic trend line — default settings are ATR Length 10 and Factor 3
- Green line below price signals an uptrend; red line above price signals a downtrend; the line flips when price closes beyond the current band
- It works well in trending markets but produces frequent false signals (whipsaws) in choppy, range-bound conditions
- No single setting is universally correct — always match the Factor to the instrument’s typical volatility
- Use Supertrend as a trend filter alongside volume, momentum, or structural confirmation — never as a standalone system
Quick Answer
Supertrend is a built-in, free TradingView indicator that plots a single line above or below price using Average True Range (ATR) to set its distance dynamically. When price trades above the line, it plots below in green — signalling an uptrend. When price trades below, the line flips above in red — signalling a downtrend. The default settings are ATR Length 10 and Factor (Multiplier) 3. It works well in trending markets and produces frequent false signals — whipsaws — in choppy, range-bound conditions. Supertrend is best used as a trend filter alongside other tools, not as a standalone trading system.
Open TradingView free and add Supertrend to any chart today.
What Is the Supertrend Indicator?
Supertrend was developed by Olivier Seban and published in his book “Tout le monde peut être riche” (Everyone Can Be Rich). It is a volatility-adjusted trend-following indicator — a single line that plots either above or below price and flips sides whenever the trend changes direction.
The core idea is straightforward: instead of using a fixed distance from price, Supertrend uses Average True Range (ATR) to adjust how far the line sits from price based on current volatility. In a calm market, the line sits closer to price. In a volatile market, it widens automatically, giving trades more room before triggering a flip. This adaptive behaviour is what distinguishes Supertrend from a simple moving average, which stays the same distance from price regardless of how volatile the market currently is.
The visual simplicity — one line, two colours, clear flips — is exactly what makes Supertrend popular among traders who want a straightforward directional bias without running multiple overlapping indicators.
The Supertrend Formula Explained
| Component | Formula | What It Does |
|---|---|---|
| Upper Band | (High + Low) / 2 + (Multiplier × ATR) | Sets the resistance line used during a downtrend |
| Lower Band | (High + Low) / 2 − (Multiplier × ATR) | Sets the support line used during an uptrend |
| ATR (Average True Range) | Average of the true trading range over the ATR Length period | Measures current volatility — expands in volatile conditions, contracts when calm |
| Trend Flip Rule | If price closes above the Upper Band, trend flips bullish. If price closes below the Lower Band, trend flips bearish | Determines when the line switches sides and colour |
When the current close is above the Lower Band, Supertrend plots below price in green, acting as dynamic support — the market is in a confirmed uptrend. When the current close is below the Upper Band, Supertrend plots above price in red, acting as dynamic resistance — the market is in a confirmed downtrend. The flip only occurs on a confirmed close beyond the relevant band, not on an intrabar touch, which reduces (but does not eliminate) false flips from brief wicks.
How to Add Supertrend on TradingView
Supertrend is a built-in TradingView indicator and takes three clicks to add — no subscription required.
- Open any chart on TradingView
- Click the Indicators button in the top toolbar
- Type “Supertrend” in the search box and select the built-in Supertrend indicator listed under the Technicals section (not a community script)
The indicator appears immediately on the chart with its default settings — ATR Length 10 and Factor 3.
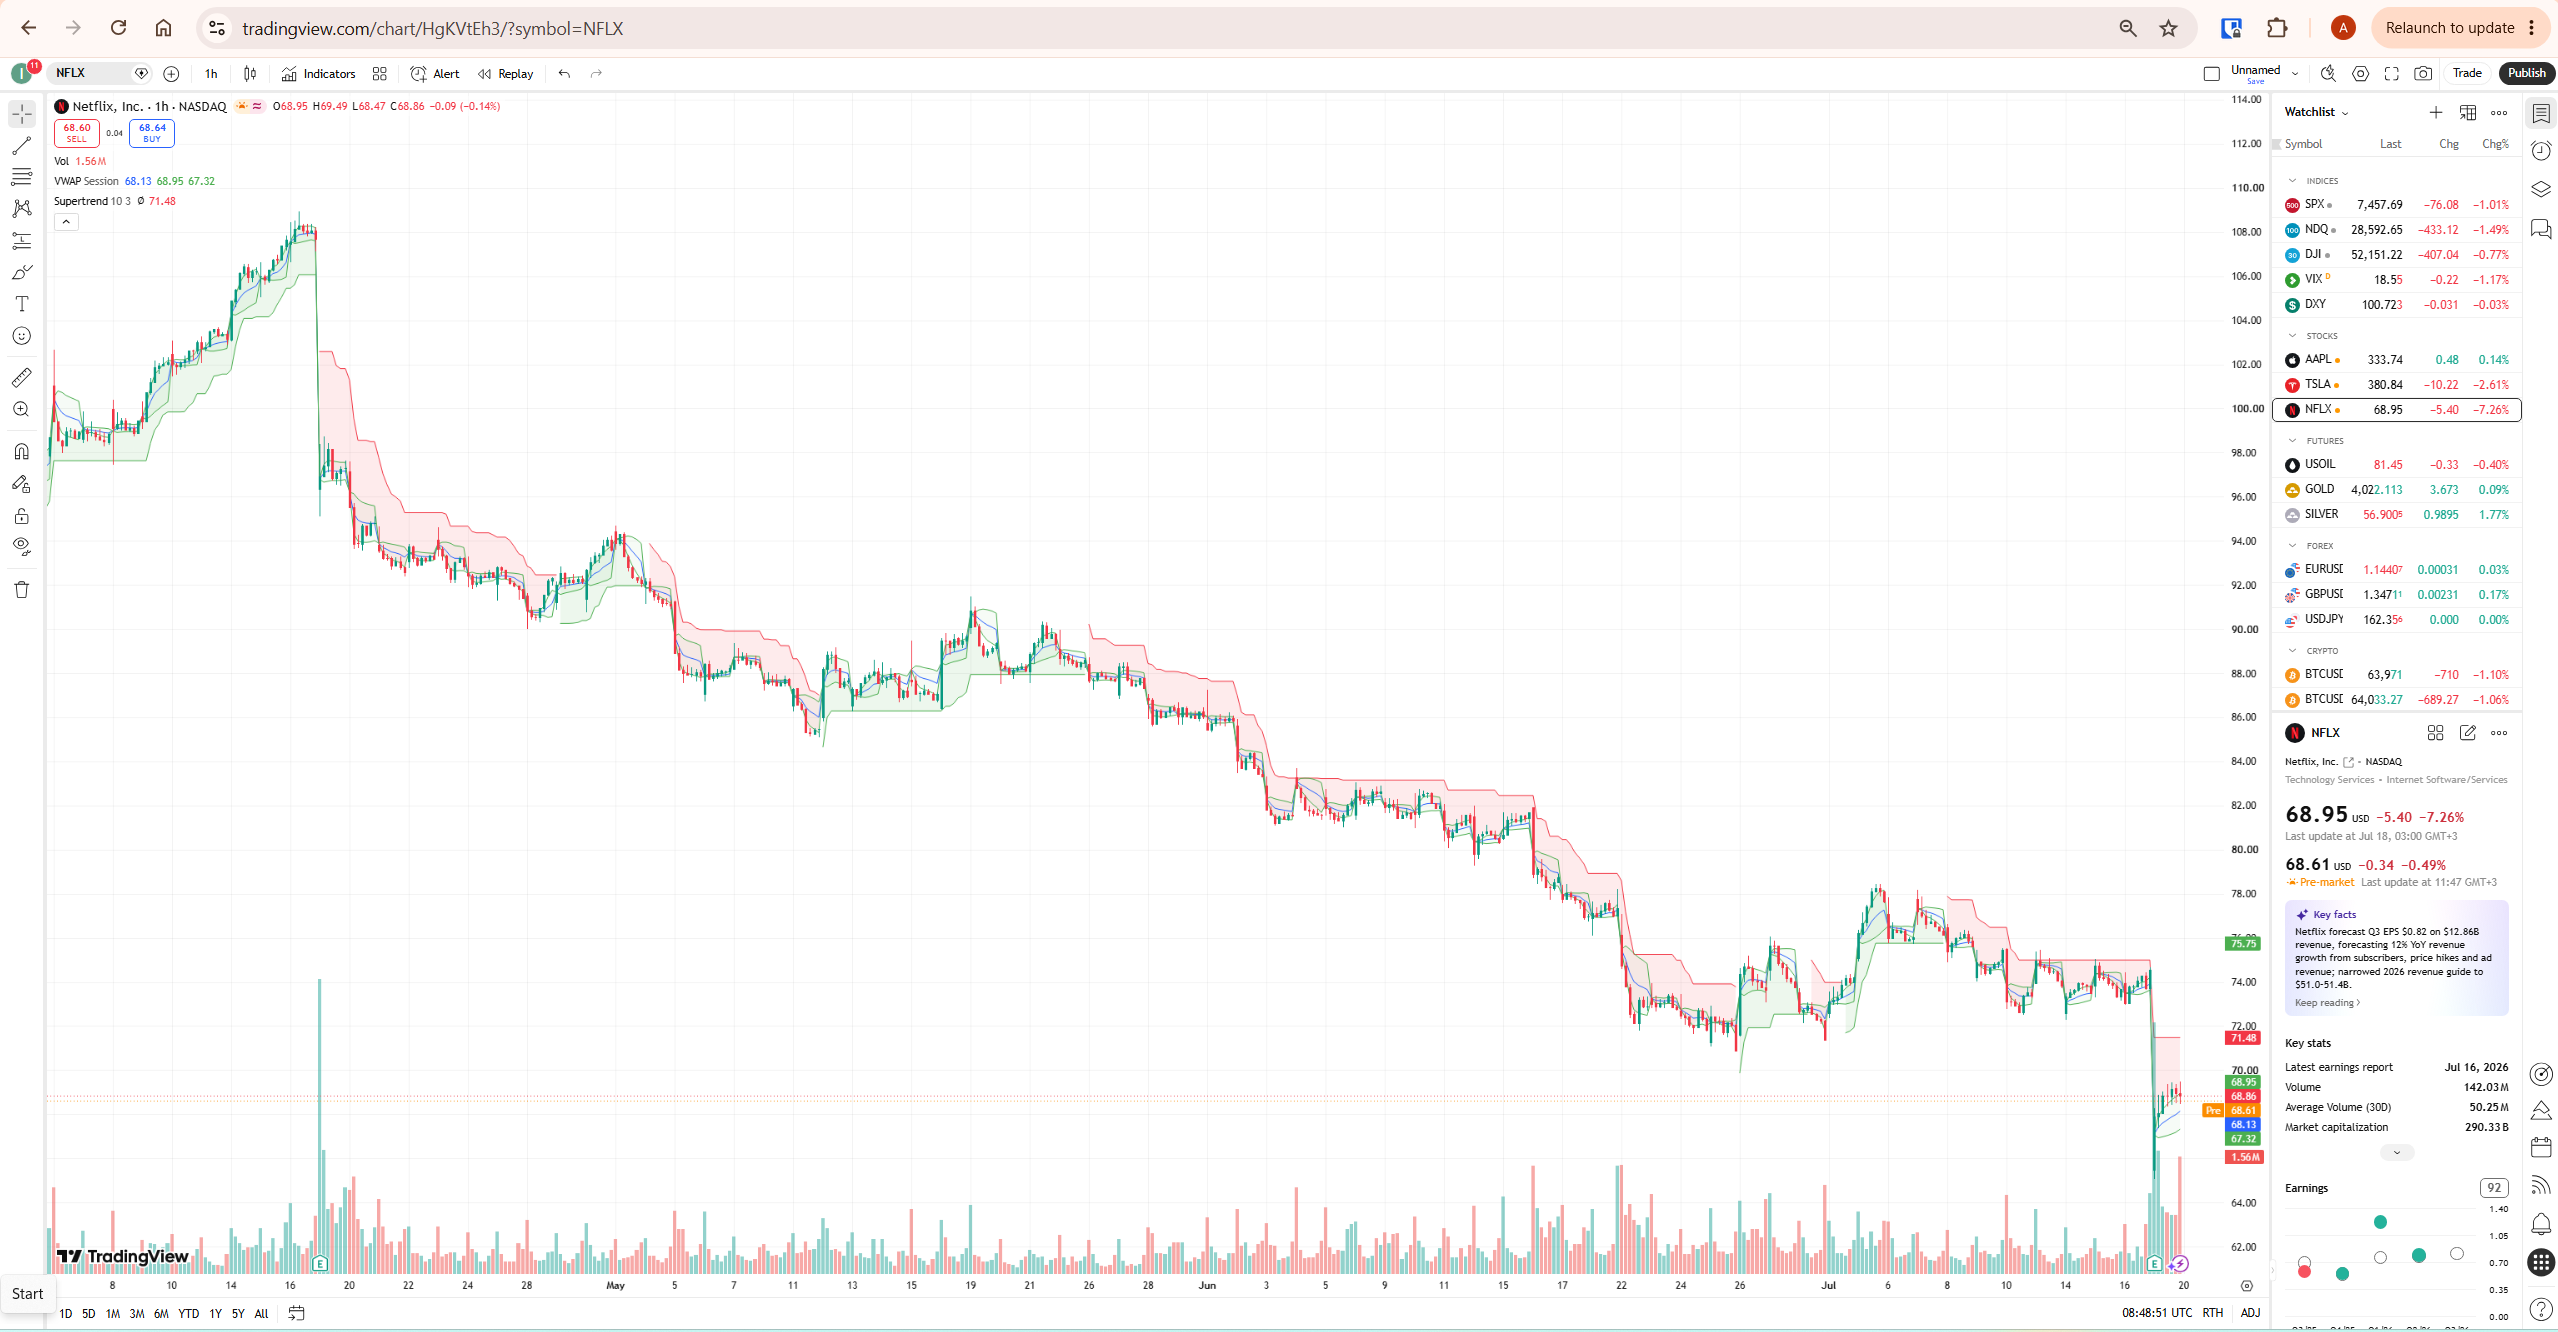
Note that on the free Basic plan, TradingView limits you to a small number of indicators per chart at once. If you already have other indicators applied and Supertrend does not appear, you may need to remove one first — check your current plan limits at tradingview.com/pricing.
Supertrend Settings: ATR Length and Factor
Right-click the Supertrend line and select Settings to access the two inputs that control its behaviour. Understanding what each one does is more useful than memorising a single “best” setting, because the right values depend on your timeframe and the asset’s typical volatility.
| Setting | Default | Effect of Lowering It | Effect of Raising It |
|---|---|---|---|
| ATR Length | 10 | More responsive to recent price action — smoother but tighter to price | Smooths the ATR further, filtering more noise but reacting more slowly |
| Factor (Multiplier) | 3 | Line sits closer to price — more frequent flips, more sensitive, more false signals | Line sits further from price — fewer flips, smoother trend read, more lag on reversals |
The relationship is a direct trade-off. Lower values make Supertrend faster to react but noisier — you catch trend changes earlier but also get whipsawed more often in choppy conditions. Higher values make it slower but cleaner — fewer false signals, at the cost of giving back more profit before confirming a genuine reversal.
Best Supertrend Settings by Timeframe and Asset
There is no single universally “best” setting — the right combination depends on the asset’s volatility profile and your trading timeframe. The figures below are commonly used starting points reported across trading communities; treat them as a starting point to test, not a guarantee.
| Use Case | Timeframe | ATR Length | Factor | Notes |
|---|---|---|---|---|
| General starting point | Any | 10 | 3 | The TradingView default — reasonable for initial testing on any asset |
| Intraday crypto (e.g. BTC) | 1H | 10 | 3.0 | Standard starting point for higher-volatility crypto pairs |
| Swing crypto | Daily | 14 | 3.5 | Wider factor accommodates crypto’s larger daily swings |
| Intraday commodities (e.g. gold) | 15M | 7 | 2.5 | Tighter settings suit lower-volatility intraday commodity moves |
| Positional / swing equities | Daily / 4H | 10 | 3 | Default settings generally hold up well for swing equity positions |
| Longer-term position trading | Daily / Weekly | Longer (e.g. 20+) | Wider (e.g. 6+) | Some traders experiment with substantially longer ATR periods and wider factors to filter for only major trend changes — test thoroughly before relying on any specific figure |
Start with the defaults on any new instrument, observe how it behaves across at least a few weeks of price history, and adjust only one parameter at a time. Changing both ATR Length and Factor simultaneously makes it difficult to know which change actually improved or worsened performance.
How to Read Supertrend Signals
| What You See | What It Signals | How to Use It |
|---|---|---|
| Line plots green below price | Confirmed uptrend — buyers in control | Favour long positions; the line acts as dynamic trailing support |
| Line plots red above price | Confirmed downtrend — sellers in control | Favour short positions; the line acts as dynamic trailing resistance |
| Line flips from red to green | Potential new uptrend beginning | A common long entry trigger — stronger when confirmed by volume or a secondary indicator |
| Line flips from green to red | Potential new downtrend beginning | A common short entry trigger or exit signal for existing longs |
| Frequent flips in a short period | Choppy, range-bound market — trend-following conditions are poor | Reduce position size or avoid trading this instrument until a clearer trend emerges |
Many trend-following traders use Supertrend as a trailing stop mechanism rather than purely an entry signal — staying in a long position until the line flips from green to red, rather than exiting at a fixed profit target. This approach captures longer trend legs but requires discipline, since it means giving back some open profit before the exit signal triggers.
Combining Supertrend with Other TradingView Tools
Supertrend is at its most reliable when it confirms a signal already suggested by another tool, rather than being used in isolation.
Supertrend and Volume: A trend flip accompanied by a clear increase in volume carries more weight than the same flip on thin volume. Weak-volume flips are more likely to be false signals that reverse quickly.
Supertrend and RSI: Using RSI to confirm that momentum supports a Supertrend flip helps filter weaker signals. A bullish flip with RSI holding above 50 carries more conviction than the same flip with RSI still in oversold territory. See our TradingView RSI Divergence guide for how to read momentum alongside trend signals.
Supertrend and MACD: Confirming a Supertrend flip with a matching MACD crossover reduces false signals further — when both a trend-following tool and a momentum tool agree, the flip carries more conviction than either alone. See our TradingView MACD guide for the full setup.
Supertrend and VWAP: On intraday charts, using VWAP as a session bias filter alongside Supertrend’s directional signal adds a layer of institutional-benchmark context to the trend read. See our TradingView VWAP guide for the full setup.
Supertrend and structural levels: A trend flip that occurs near a key support or resistance level, or aligns with a high-volume node from Volume Profile, is more significant than a flip occurring in open space with no nearby structure. See our TradingView Volume Profile guide for identifying these confluence zones.
Setting Supertrend Alerts on TradingView
Rather than watching charts continuously for a flip, TradingView’s alert system can notify you the moment Supertrend changes direction.
- Add Supertrend to your chart
- Right-click the indicator name and select Add Alert
- Choose the trend change condition from the available alert options
- Set your notification method — push, email, or webhook depending on your plan
- Use Once Per Bar Close frequency to avoid multiple alerts firing on the same flip during intrabar volatility
For the complete alert setup process, see our TradingView Alerts Explained guide. Alert capacity and webhook availability depend on your plan — verify current limits at tradingview.com/pricing.
Supertrend for Crypto Trading on TradingView
Supertrend is widely used in crypto trading because major cryptocurrencies tend to move through extended trending phases — exactly the market condition where trend-following tools perform best. Extended crypto trends on daily and weekly charts often produce clean, sustained Supertrend readings with fewer whipsaws than shorter timeframes.
The trade-off is that crypto’s higher baseline volatility means a wider Factor is often needed to avoid excessive false flips — many crypto traders start with Factor 3.5 or higher on daily charts rather than the standard default of 3. On lower timeframes (1H or below), crypto’s rapid, sharp reversals can trigger frequent flips even with wider settings, so testing thoroughly on your specific pair before relying on it is essential.

Common Supertrend Mistakes on TradingView
The most common mistake is using Supertrend alone as a complete trading system. The clean visual — one line, one colour, one signal — makes it tempting to treat every flip as an automatic trade. In practice, Supertrend works best as a trend filter or trailing stop mechanism used alongside confirmation from volume, momentum, or structural levels.
The second mistake is applying Supertrend to range-bound or choppy markets without recognising the conditions have changed. Supertrend is a trend-following tool — in a market moving sideways, it generates frequent flips that whipsaw traders in and out of positions with no net progress. Recognising when a market has shifted from trending to ranging (often visible through repeated, closely-spaced flips) and standing aside is as important as reading the signal itself.
The third mistake is using the same settings across every asset and timeframe. A Factor of 3 that works well on a daily equity chart may produce excessive whipsaw on a volatile 15-minute crypto chart. Adjust the Factor to match the specific instrument’s typical volatility rather than assuming the default is universally correct.
The fourth mistake is ignoring how much profit is given back before an exit signal triggers. Because Supertrend only flips after price closes beyond the band, a portion of the move has already reversed by the time the exit signal appears. This lag is a structural feature of trend-following indicators generally, not a flaw unique to Supertrend, but it should be factored into position sizing and risk management.
Honest Limitation: When Supertrend Fails
Supertrend is a trend-following indicator, and like every trend-following tool, it performs poorly in exactly the conditions where markets spend a significant portion of their time: sideways, range-bound consolidation. During these periods, price oscillates back and forth across the Supertrend bands repeatedly, generating a rapid sequence of buy and sell flips that produce losses on transaction costs and slippage alone, even before considering the whipsaw itself.
There is no setting adjustment that eliminates this limitation entirely — widening the Factor reduces the frequency of false flips but also delays genuine trend-change signals, meaning you give back more profit on real trends in exchange for fewer false signals during range-bound periods. This is an unavoidable trade-off inherent to any ATR-based trend-following system, not a flaw specific to Supertrend’s implementation.
A further limitation is that Supertrend, like all trend-following indicators, is inherently reactive rather than predictive. It confirms a trend change after price has already moved — it does not anticipate the change before it happens. Traders who expect Supertrend to catch the exact top or bottom of a move will be consistently disappointed; the tool is designed to capture the middle portion of a trend, not the extremes.
The responsible framing: use Supertrend to establish directional bias and manage trailing exits within an existing trend, combined with a method for recognising when market conditions have shifted from trending to ranging. For deeper context on ATR-based volatility measurement, Investopedia’s ATR guide explains the underlying calculation that Supertrend is built on.
What To Do Next
Before turning a Supertrend idea into a live strategy, review it on historical charts and, where possible, test the rules systematically. Our TradingView Strategy Tester guide explains how to evaluate rule-based setups before risking real capital.
Open TradingView, add Supertrend with default settings to an instrument you follow regularly, and scroll back through at least three months of price history. Count how many flips occurred during trending periods versus how many occurred during sideways consolidation. This exercise will show you directly how often the indicator would have kept you in a genuine trend versus how often it would have whipsawed you during a range — before you risk any capital on a live signal.
Create a free TradingView account to add Supertrend to your charts at no cost.
Related TradingView Guides
- TradingView MACD — combining a momentum confirmation tool with Supertrend’s directional signal
- TradingView VWAP — combining VWAP session bias with Supertrend’s directional signal
- TradingView RSI Divergence — confirming Supertrend flips with momentum analysis
- TradingView Volume Profile — identifying structural levels where trend flips carry more weight
- TradingView Alerts Explained — automating notifications for Supertrend flips
- TradingView Strategy Tester — backtesting Supertrend-based strategies before live use
Frequently Asked Questions
What is the Supertrend indicator on TradingView?
Supertrend is a built-in, free TradingView indicator that plots a single line above or below price, flipping sides when the trend direction changes. It uses Average True Range (ATR) to adjust its distance from price dynamically based on current market volatility. When the line plots below price in green, the market is in an uptrend; when it plots above price in red, the market is in a downtrend. It was developed by Olivier Seban and is one of the most widely used trend-following tools on the platform.
How do I add Supertrend on TradingView?
Click the Indicators button in the top toolbar of any TradingView chart, type “Supertrend” in the search box, and select the built-in Supertrend indicator listed under the Technicals section. The indicator adds immediately with default settings of ATR Length 10 and Factor 3. Note that free Basic plan accounts have a limit on the number of indicators that can be applied to a chart simultaneously — you may need to remove another indicator first if you have reached your plan’s limit.
What are the best Supertrend settings?
The TradingView default of ATR Length 10 and Factor 3 is a reasonable starting point for most instruments and timeframes. For higher-volatility assets like crypto, a wider Factor (3.5 or higher) on daily charts is commonly used to reduce false flips. For lower-volatility intraday instruments, a shorter ATR Length (7) with a tighter Factor (2.5) may respond faster. There is no universally correct setting — always test on historical data for your specific instrument and timeframe before applying live.
Is Supertrend free on TradingView?
Yes. Supertrend is a built-in TradingView indicator available at no cost on the free Basic plan. At the time of writing it does not require a paid subscription. Note that Basic plan accounts have a limit on the total number of indicators that can be applied per chart simultaneously — always verify current plan limits at tradingview.com/pricing.
Does Supertrend repaint?
The standard built-in Supertrend indicator does not repaint historical bars once they have closed — the flip is confirmed based on the closing price relative to the band, and that confirmed value does not change retroactively. However, some community-modified Supertrend variants may use different logic. If using a community script rather than the official built-in version, check the script’s description for repainting behaviour before relying on its signals.
What is the best timeframe for Supertrend?
Supertrend works across all timeframes, but its reliability improves on higher timeframes where genuine trends have more room to develop and short-term noise is filtered out. Daily and 4-hour charts generally produce cleaner, more reliable Supertrend signals than 1-minute or 5-minute charts, which are prone to frequent whipsaws from short-term volatility. Day traders often use Supertrend on a higher timeframe as a directional filter, then time entries on a shorter timeframe within that established bias.
Can Supertrend be used for crypto trading?
Yes, Supertrend is widely used in crypto trading and is commonly used during Bitcoin and major altcoin trending phases, particularly on daily and weekly charts. Because crypto has higher baseline volatility than most traditional assets, a wider Factor setting (commonly 3.5 or higher) is often used to reduce false flips compared to the standard default of 3. On lower timeframes, crypto’s rapid reversals can still trigger frequent whipsaws even with wider settings, so thorough testing on your specific pair is recommended before live use.
Is Supertrend better than Moving Averages?
Neither is universally better — they serve overlapping but distinct purposes. Supertrend’s ATR-based approach adapts to changing volatility automatically, giving it an edge in markets where volatility varies significantly over time. A simple moving average stays a fixed distance behind price regardless of volatility, which can make it slower to adjust in fast-moving conditions but also less prone to sudden, volatility-driven flips. Many traders use both together — a moving average for the broader trend context and Supertrend for a more responsive, adaptive trailing stop within that trend.
Trading disclaimer: Trading involves risk. This article is for educational purposes only and is not financial advice. Technical analysis tools do not guarantee profitable results. Past performance is not indicative of future results. Always manage your risk appropriately.
