
TradingView Fibonacci Retracement: Best Complete Guide (2026)
Affiliate Disclosure: This article contains affiliate links. If you sign up for TradingView through a link on this page, I may earn a commission at no extra cost to you. I only recommend tools I have researched and believe are relevant to the reader’s use case.
Trading involves risk. This article is for educational purposes only and is not financial advice. Technical analysis tools do not guarantee profitable results. Past performance is not indicative of future results. Always manage your risk appropriately.
Last verified: August 2026, using TradingView’s official documentation and drawing tools library.
TradingView Fibonacci Retracement is a free drawing tool available on every plan including Basic, and it remains one of the most widely used tools among technical traders across every asset class. I am Andreas Maratheftis, and after 30 years in professional finance I can tell you that Fibonacci retracement is simultaneously one of the most useful and one of the most abused tools in trading — useful because it gives you objective reference levels most other traders are also watching, and abused because two traders can draw it on the same chart and get meaningfully different results depending on which swing points they choose. This guide covers exactly how to draw it correctly on TradingView, what the levels actually mean, the golden pocket concept, and the honest limitation that no Fibonacci guide wants to admit.
Key Takeaways
- Fibonacci Retracement is a free drawing tool on TradingView, found in the left toolbar under Gann and Fibonacci Tools — not the Indicators menu
- Standard levels are 0.236, 0.382, 0.5, 0.618, and 0.786 — the 61.8%–78.6% zone is known as the “golden pocket”
- Draw from swing low to swing high in an uptrend, or swing high to swing low in a downtrend
- Fibonacci Extension levels (1.272, 1.618, 2.0) are a separate but related tool used for projecting profit targets beyond the original move
- The tool’s biggest weakness is subjectivity — where you anchor the swing points changes every level, and there is no single “correct” anchor
Quick Answer
TradingView Fibonacci Retracement is available free on every TradingView plan and helps traders identify potential pullback levels within an existing trend. It is a drawing tool, not a built-in indicator, found in the left-side toolbar under the Gann and Fibonacci Tools group. Draw it by clicking a swing low and dragging to a swing high (in an uptrend) or the reverse in a downtrend — TradingView automatically plots the standard levels between the two points: 0.236, 0.382, 0.5, 0.618, and 0.786. Traders watch these levels as potential pullback zones during an established trend, with the area between 61.8% and 78.6% — the “golden pocket” — considered the highest-probability continuation zone. The tool’s core weakness is that swing point selection is subjective, so two traders can draw meaningfully different levels on the identical chart.
Open TradingView free and draw your first Fibonacci retracement today.
What Is Fibonacci Retracement?
Fibonacci retracement levels are horizontal lines drawn between two extreme points on a chart — typically a significant swing low and swing high — marking percentages of that move where price has historically tended to pause, reverse, or continue. The percentages themselves derive from the Fibonacci sequence, where each number is the sum of the two preceding it (0, 1, 1, 2, 3, 5, 8, 13…). Dividing numbers in the sequence by their neighbours produces the ratios traders use: 0.236, 0.382, 0.618, and 0.786.
The 50% level is worth noting specifically — it is not a true Fibonacci ratio, but it sits at the exact midpoint of any move, and traders watch it closely regardless because price reacts there frequently enough that it has become a de facto standard level alongside the mathematically derived ones.
The underlying logic is behavioural rather than purely mathematical: after a strong directional move, a meaningful portion of market participants who missed the initial move look to enter on a pullback. Because many traders reference the same Fibonacci levels, those levels can become somewhat self-fulfilling — not because the ratios have inherent market-moving power, but because enough participants are watching the same zones and acting near them.
How to Draw Fibonacci Retracement on TradingView
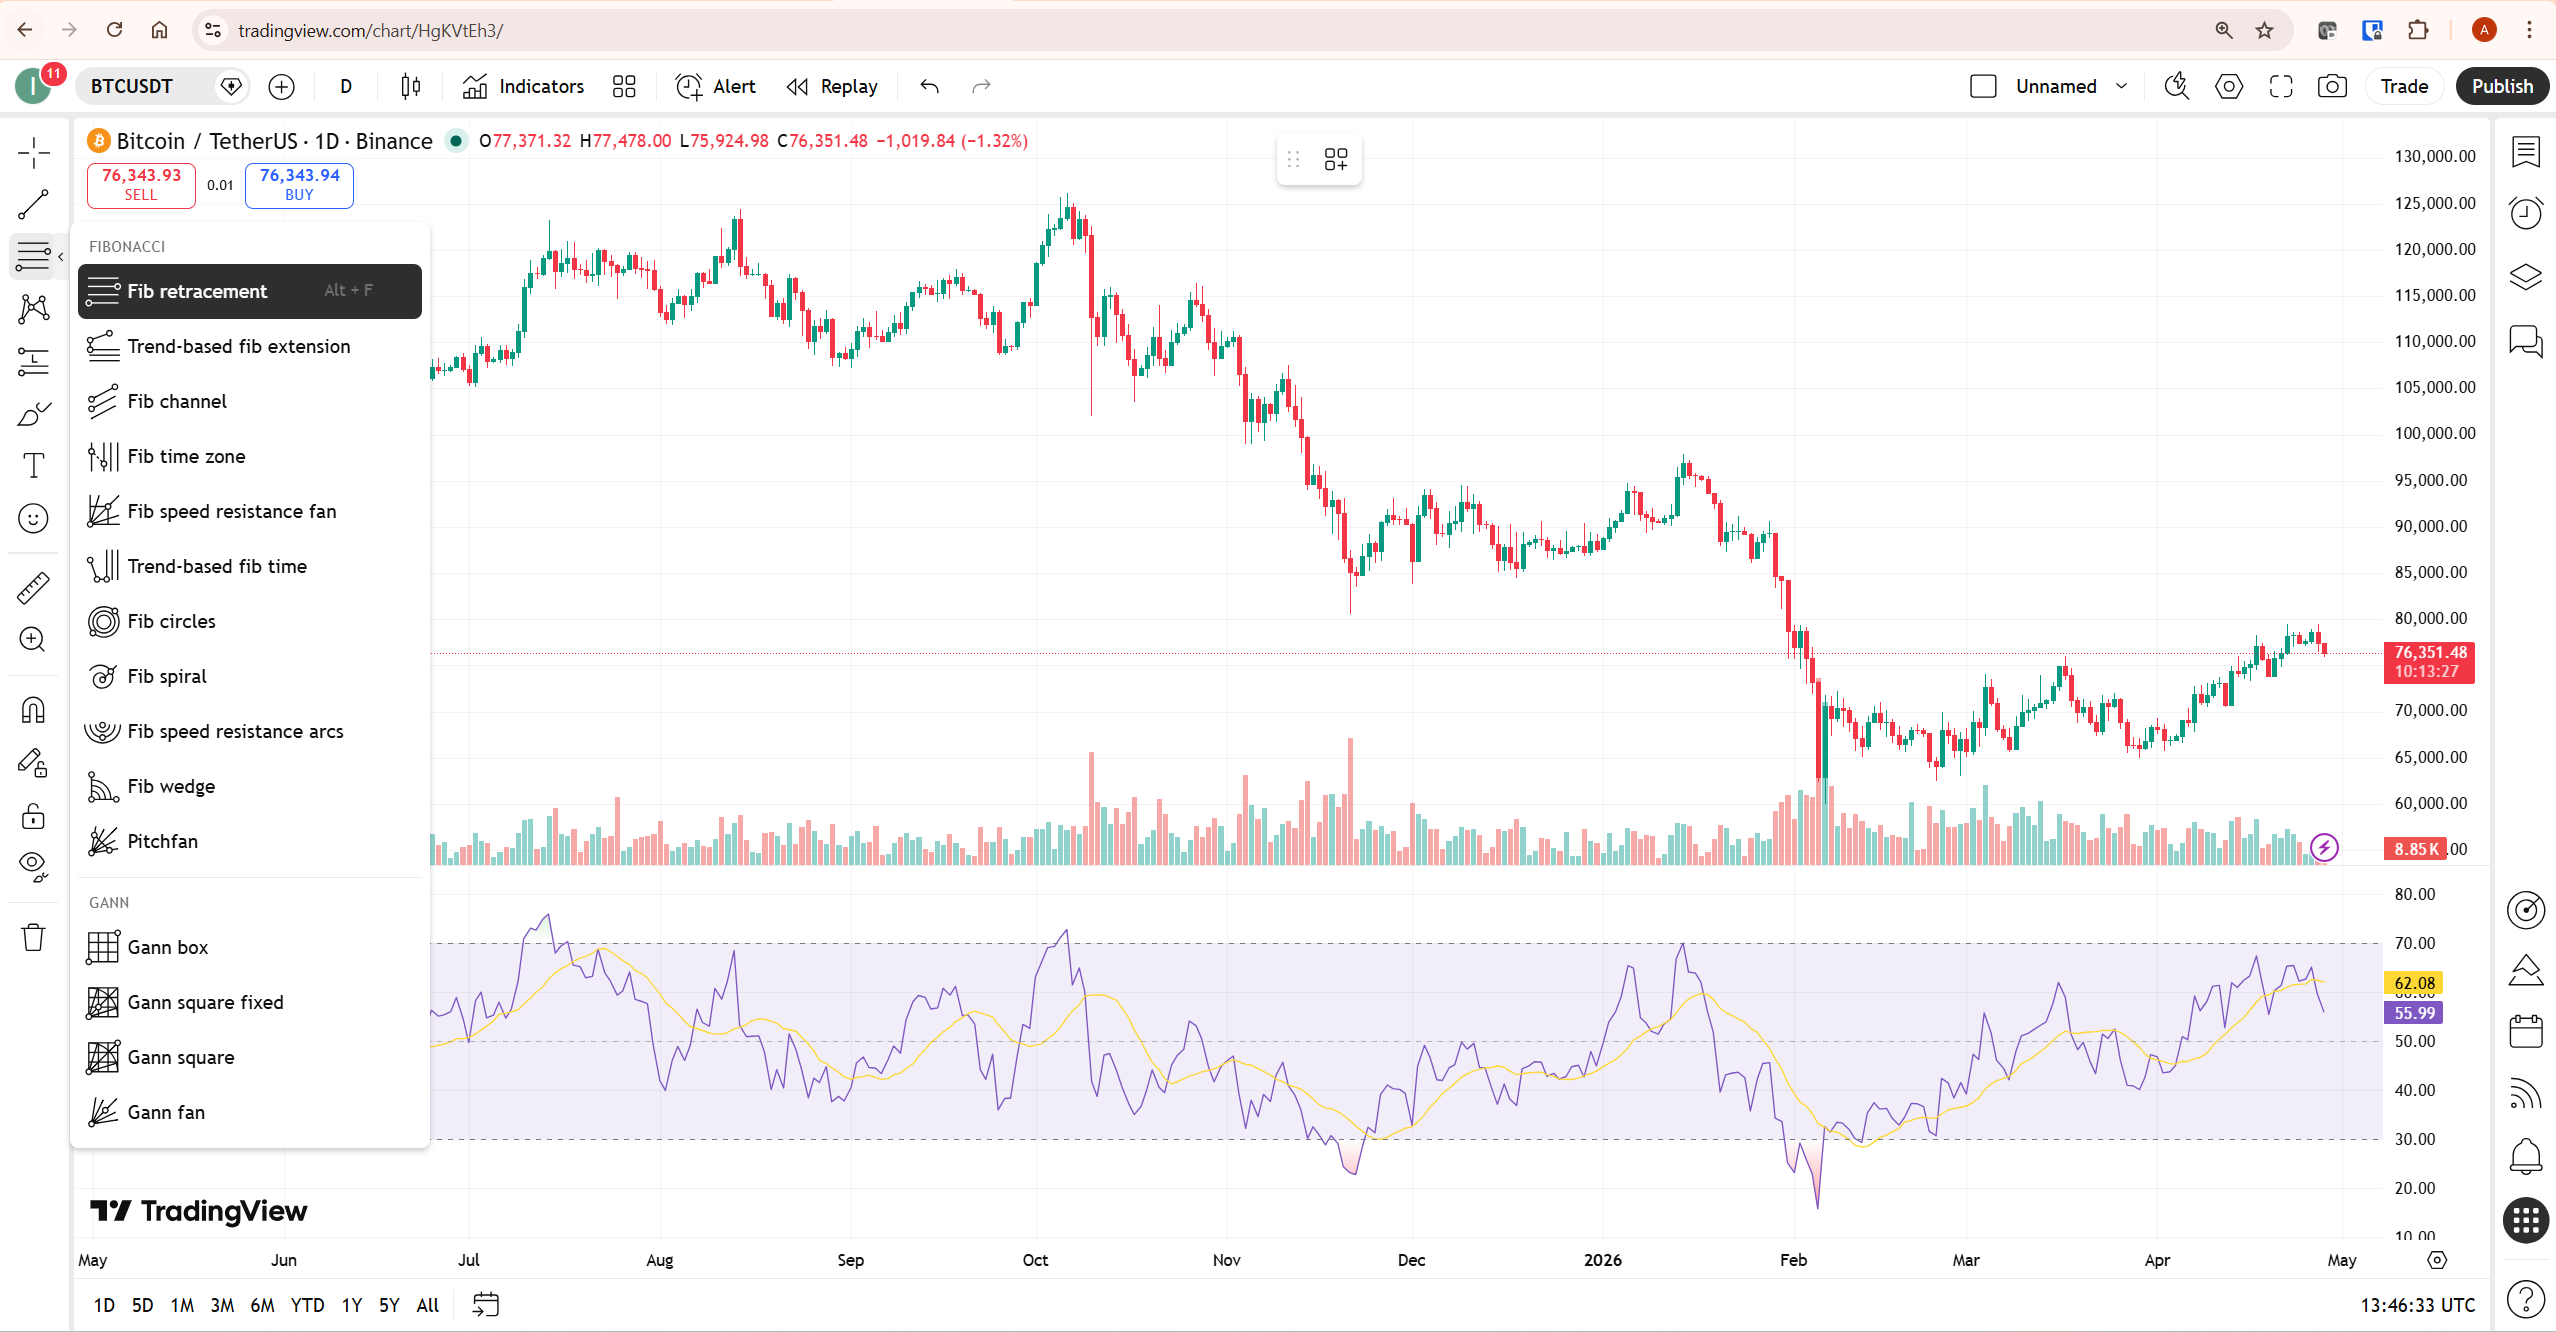
Fibonacci Retracement is a drawing tool, not a standard indicator, so it is not found through the Indicators search box. It lives in the left-side drawing toolbar.
- Open any chart on TradingView
- Look in the left-side toolbar for the Gann and Fibonacci Tools group — it is typically represented by an angled-line icon
- Select Fib Retracement from the dropdown list of tools in that group
- Identify a clear swing point on your chart before clicking — in an uptrend, find the swing low that started the move; in a downtrend, find the swing high
- Click the starting swing point, then drag to the ending swing point and click again to complete the drawing
TradingView automatically calculates and plots all the standard levels between your two chosen points the moment you complete the drawing. The tool is available on all plans including the free Basic tier — no subscription required. For faster access, the keyboard shortcut Alt+F (Option+F on Mac) selects the Fibonacci Retracement tool directly without navigating the toolbar menu.
Getting the direction right matters. In an uptrend — higher highs and higher lows — draw from the swing low to the swing high. In a downtrend — lower highs and lower lows — draw from the swing high to the swing low. Drawing in the wrong direction inverts the levels and produces a meaningless read.
The Standard Fibonacci Levels Explained
| Level | Type | What Traders Watch For |
|---|---|---|
| 23.6% | Shallow retracement | A minor pullback in a very strong trend — often too shallow to act on alone |
| 38.2% | Fibonacci ratio | A common pullback level in strong trends — frequently holds when momentum is high |
| 50% | Not a true Fibonacci ratio | The midpoint of the move — widely respected despite not being derived from the sequence |
| 61.8% | The “golden ratio” | Often considered the last clean pullback level before trend continuation — start of the golden pocket |
| 78.6% | Deep retracement | A deep pullback — end of the golden pocket; a break beyond this level often signals the original trend is failing |
The zone between 61.8% and 78.6% is commonly referred to as the “golden pocket” — considered by many technical traders to be the highest-probability zone for a trend-continuation entry, particularly when it overlaps with another form of confluence such as a moving average or a prior support and resistance level. A retracement beyond 78.6% is generally treated as a signal that the original impulsive move has likely failed rather than simply pausing.
A worked example: if a stock rallies from $100 (swing low) to $150 (swing high), the total move is $50. The 38.2% level sits at $150 − (0.382 × $50) = $130.90. The 50% level sits at $125.00. The 61.8% level — the start of the golden pocket — sits at $119.10, and the 78.6% level at the far edge of the golden pocket sits at $110.70. A pullback that holds anywhere in the $110.70–$119.10 range is inside the golden pocket; a close below $110.70 suggests the original rally may be failing rather than simply resting.
Customising Fibonacci Retracement Settings on TradingView
Right-click any line on a drawn Fibonacci retracement and select Settings to access customisation options.
Levels tab: Add, remove, or adjust the value of any level. The default set (0, 23.6, 38.2, 50, 61.8, 78.6, 100) works well for most traders, but you can add extension-style levels above 100% if you want a single drawing that covers both retracement and projection.
Style tab: Adjust line colour, thickness, and whether the background between levels is filled with colour. A filled background between the 61.8% and 78.6% levels — visually highlighting the golden pocket — makes the zone easier to spot at a glance without needing to read the exact numbers each time.
Extend lines: Enable this to project the Fibonacci levels forward as horizontal lines across the rest of the chart, which is useful for watching whether price respects the same level again on a future test, not just the initial retracement.
Once configured to your preference, right-click and select “Save as default template” so every new Fibonacci drawing on future charts uses the same styling automatically.
Fibonacci Extension: Projecting Targets Beyond the Move
Fibonacci Extension is a separate but closely related drawing tool, also found in the Gann and Fibonacci Tools group. Where retracement measures pullback levels within a completed move, extension projects levels beyond the original move — used for setting profit targets once a retracement has held and the trend appears to be resuming.
The most commonly used extension levels are 1.272, 1.618, and 2.0. A typical workflow: after price bounces from a Fibonacci retracement level and breaks back above the prior high in an uptrend, the extension tool projects where the next leg of the move might reasonably be expected to encounter resistance, giving a data-informed basis for a take-profit level rather than an arbitrary one.
Retracement and extension are frequently used together on the same setup — retracement to identify the entry zone, extension to identify the target zone — turning a single swing structure into a complete trade framework with both an entry reference and an exit reference.
Fibonacci Retracement vs Fibonacci Extension
| Fibonacci Retracement | Fibonacci Extension | |
|---|---|---|
| Purpose | Measures potential pullback levels within a completed move | Projects potential target levels beyond the original move |
| Level range | Uses levels below 100% (23.6%–78.6%) | Uses levels above 100% (127.2%–200%) |
| Typical use | Identifying entry zones during a pullback | Setting profit targets once the trend resumes |
Best Timeframes for Fibonacci Retracement
Fibonacci retracement works on every timeframe TradingView supports, but reliability generally improves as the timeframe increases, because higher timeframes filter out the short-term noise that makes swing points ambiguous.
| Timeframe | Reliability | Best Suited For |
|---|---|---|
| 5M–15M | Lower — swing points are frequently ambiguous | Scalping, only when anchored to a swing visible on a higher timeframe |
| 1H | Moderate | Day trading, intraday pullback entries within an established daily trend |
| Daily | Higher | Swing trading — the most commonly used timeframe for Fibonacci analysis |
| Weekly | Highest | Position trading and identifying major structural levels |
A practical approach many traders use: identify the impulsive swing on the daily or weekly chart where it is unambiguous, then drop to a lower timeframe such as 1H only to fine-tune the entry once price has reached the zone already identified on the higher timeframe — rather than trying to identify the swing itself on a noisy lower timeframe.
Combining Fibonacci Retracement with Other TradingView Tools
A Fibonacci level on its own is one trader’s opinion about where a swing might matter. Confluence with another independent signal is what turns that opinion into a stronger setup.
Fibonacci and moving averages: When a Fibonacci level lines up closely with a widely watched moving average — the 50 or 200-period, for example — that overlap is treated as stronger confluence than either signal alone, since two independently derived methods are pointing to the same price zone.
Fibonacci and RSI: Price reaching a golden pocket level while RSI simultaneously shows a bullish divergence adds a momentum-based confirmation layer to a purely price-structure-based tool. See our TradingView RSI Divergence guide for how to read that signal correctly. For the official technical specification of the tool, TradingView’s own Fib Retracement documentation confirms the full set of 24 configurable levels available. For further background on how technical analysts frame confluence between multiple tools, the StockBrokers.com TradingView review covers the platform’s broader charting toolkit.
Fibonacci and Volume Profile: A Fibonacci retracement level that aligns with a high-volume node from Volume Profile — a price level where significant historical trading activity occurred — carries considerably more structural weight than a Fibonacci level sitting in an area with no volume history behind it. See our TradingView Volume Profile guide for identifying these zones.
Fibonacci and MACD: A price bounce off a golden pocket level accompanied by a bullish MACD crossover strengthens the case that the pullback has genuinely ended rather than continuing further. See our TradingView MACD guide for the full setup.
Setting Fibonacci Alerts on TradingView
Rather than watching a chart continuously to see whether price reaches a specific Fibonacci level, TradingView’s alert system can notify you automatically.
- Draw the Fibonacci retracement on your chart
- Right-click directly on the specific level line you want to monitor — for example, the 61.8% line
- Select Add Alert from the context menu
- Confirm the condition is set to trigger when price crosses that exact level
- Set your notification method and use Once Per Bar Close frequency to avoid repeated alerts from brief intrabar touches
For the complete alert setup process across all TradingView plans, see our TradingView Alerts Explained guide. Alert capacity and webhook availability depend on your plan — verify current limits at tradingview.com/pricing.
Fibonacci Retracement for Crypto Trading on TradingView
Fibonacci retracement is heavily used in crypto trading, in part because major crypto assets tend to produce clean, sizeable impulsive swings on higher timeframes — exactly the structure the tool is designed to measure. Analysis of major crypto corrections has found the 61.8% level respected in a meaningful majority of significant pullbacks, though these historical hit-rate figures should be treated as directional context rather than a guaranteed edge on any individual trade.
Crypto’s higher baseline volatility means swing points can be genuinely ambiguous — a move that looks like a single clean impulsive leg on a daily chart may contain several smaller, conflicting swings on a lower timeframe. Anchoring the Fibonacci drawing to the highest timeframe where the swing is unambiguous, then confirming the resulting levels hold up when viewed on the timeframe you actually trade, reduces the risk of drawing from a swing point that other market participants are not also watching.

Common Fibonacci Retracement Mistakes on TradingView
The most common mistake is choosing swing points that are not genuinely significant. If you cannot identify the impulsive leg you are measuring within a few seconds of looking at the chart, the anchor points are probably too subjective to be useful. A clear, obvious swing — sharp reversal candles, expanding range, strong directional closes — produces far more reliable levels than a swing selected simply because it produces a chart pattern you were hoping to see.
The second mistake is treating every Fibonacci level as an automatic entry signal without waiting for price action confirmation. A level being touched does not mean it will hold — it means price has reached a zone worth watching closely. A rejection candle, a bullish engulfing pattern, or a confirmed close back above the level provides the confirmation a bare touch does not.
The third mistake is redrawing the Fibonacci retracement repeatedly until the levels happen to match a trade idea already decided in advance. This is a form of confirmation bias that undermines the entire purpose of using an objective tool — the anchor points should be selected based on clear chart structure, not adjusted after the fact to justify a predetermined conclusion.
The fourth mistake is using Fibonacci retracement in isolation on a market with no clear trend. The tool measures pullbacks within an established directional move — in a genuinely range-bound market with no clear impulsive leg to anchor to, Fibonacci levels carry little meaning because there is no clean structure for them to measure against.
Honest Limitation: The Subjectivity Problem
Fibonacci retracement’s core limitation is one that most guides gloss over: the levels are entirely dependent on which two swing points you choose, and there is no universally agreed rule for selecting them. Two experienced traders looking at the identical chart can reasonably select different swing points and produce meaningfully different levels — both technically valid, both potentially useful, but disagreeing with each other.
This is a structural limitation, not something that improves with a better setting or a different TradingView configuration. Unlike an indicator with a fixed mathematical formula that produces the same output for the same input every time, Fibonacci retracement requires a subjective judgment call at the first step — before any level is even calculated.
A further limitation is that the historical “hit rate” statistics often cited for specific levels — claims that the 61.8% level held in some percentage of past corrections — are backward-looking observations on a specific dataset, not a forward guarantee. The same level that respected price repeatedly in one market cycle can be broken cleanly and repeatedly in a different cycle with different underlying conditions.
Over three decades in finance, I have found Fibonacci works best as a framework for identifying areas of interest rather than as a standalone trading signal. The responsible framing: use Fibonacci retracement to identify zones worth watching for confirmation, anchored to the clearest and most obvious swing structure available, and treat every level as a hypothesis to be confirmed by price action rather than a rule to be traded blindly. Combining Fibonacci levels with an independent form of confluence — volume, momentum, or a moving average — meaningfully reduces the impact of the tool’s inherent subjectivity.
What To Do Next
Before turning a Fibonacci-based idea into a live strategy, review it on historical charts and, where possible, test the rules systematically. Our TradingView Strategy Tester guide explains how to evaluate rule-based setups before risking real capital, and Investopedia’s backtesting guide covers the general principles of testing any strategy against historical data responsibly.
Open TradingView, find an instrument with a clear recent impulsive swing, and draw a Fibonacci retracement from the obvious swing low to swing high (or the reverse in a downtrend). Note where the golden pocket sits, then scroll back through the chart’s history and find three or four prior swings on the same instrument. Draw a retracement on each and observe how often price actually respected the golden pocket versus how often it broke straight through. That exercise, repeated on the specific instrument you trade, will teach you more about the tool’s real reliability than any statistic from a different market.
Create a free TradingView account to add Fibonacci Retracement to your charts at no cost.
Related TradingView Guides
- TradingView Drawing Tools — the complete guide to every tool in the left toolbar, including Fibonacci and Gann tools
- TradingView MACD — confirming Fibonacci golden pocket bounces with momentum crossovers
- TradingView RSI Divergence — adding momentum confirmation to Fibonacci retracement entries
- TradingView Volume Profile — combining structural volume levels with Fibonacci confluence
- TradingView Alerts Explained — automating notifications for specific Fibonacci levels
- TradingView Review 2026 — complete platform overview
Frequently Asked Questions
How do I draw Fibonacci retracement on TradingView?
Open the left-side toolbar and select Fib Retracement from the Gann and Fibonacci Tools group — it is a drawing tool, not something found in the Indicators search box. In an uptrend, click the swing low and drag to the swing high; in a downtrend, click the swing high and drag to the swing low. TradingView automatically calculates and plots the standard levels between the two points once the drawing is complete. The tool is free on all plans including Basic.
What are the standard Fibonacci retracement levels?
The default levels are 23.6%, 38.2%, 50%, 61.8%, and 78.6%. The 50% level is not a true Fibonacci ratio but is widely watched anyway because it marks the exact midpoint of the move. The 61.8% level is often called the “golden ratio,” and the zone between 61.8% and 78.6% is known as the “golden pocket” — considered by many traders to be the highest-probability continuation zone.
What is the golden pocket in Fibonacci retracement?
The golden pocket is the price zone between the 61.8% and 78.6% Fibonacci retracement levels. Many technical traders consider it the highest-probability area for a trend to resume after a pullback, particularly when the zone overlaps with another form of confluence such as a moving average or a prior support and resistance level. A retracement that breaks cleanly through the golden pocket without holding is often treated as a signal that the original trend may be failing rather than simply pausing.
Is Fibonacci retracement free on TradingView?
Yes. Fibonacci Retracement is a drawing tool available at no cost on the free Basic TradingView plan. At the time of writing it does not require a paid subscription. Fibonacci Extension, the related tool used for profit target projection, is also available free on all plans.
What is the difference between Fibonacci retracement and Fibonacci extension?
Fibonacci retracement measures potential pullback levels within a completed price move, using levels below 100% such as 38.2%, 50%, and 61.8%. Fibonacci extension projects levels beyond the original move, using levels above 100% such as 127.2%, 161.8%, and 200%, typically used for setting profit targets once a retracement has held and the trend appears to be resuming. Both tools are found in the same Gann and Fibonacci Tools group in TradingView’s left toolbar and are frequently used together on the same setup.
Is Fibonacci retracement reliable?
Fibonacci retracement is useful as a framework for identifying zones worth watching, but it is unreliable as a standalone entry signal. Its core weakness is subjectivity — the levels depend entirely on which swing points are selected, and there is no universal rule for that selection, meaning different traders can produce different levels on the same chart. It is most useful when combined with an independent confirmation signal such as volume, momentum, or a moving average, rather than traded on the level touch alone.
Can Fibonacci retracement be used on stocks, forex, and crypto?
Yes. Fibonacci retracement is asset-agnostic — the underlying mathematics apply equally to stocks, forex pairs, crypto, futures, and any other instrument with a price chart on TradingView. The core principle does not change across asset classes: identify a clear impulsive swing, draw the retracement, and watch how price behaves at the resulting levels. What does change is the typical volatility and swing clarity of each asset class — forex majors tend to produce cleaner, more gradual swings than crypto, while individual stocks can gap sharply around earnings in ways that complicate clean Fibonacci anchoring.
Can Fibonacci retracement be used for crypto trading?
Yes, Fibonacci retracement is widely used in crypto trading and works well on major crypto assets that produce clean, sizeable impulsive swings, particularly on higher timeframes like the daily and weekly chart. Crypto’s higher volatility means swing point selection requires extra care — a move that looks like one clean leg on a daily chart may contain several conflicting smaller swings on a lower timeframe. Anchoring to the highest timeframe where the swing is unambiguous typically produces more reliable levels than anchoring on a noisy lower timeframe.
Should beginners use Fibonacci retracement?
Yes, but with a clear expectation: Fibonacci retracement is easy to draw but genuinely difficult to use well, because correct swing point selection takes practice. Beginners benefit from starting on daily and weekly charts, where swings are clearer and more obvious, rather than short intraday timeframes where noise makes swing selection ambiguous even for experienced traders. Combining Fibonacci with a second confirmation signal from the start — rather than trading level touches alone — builds better habits than relying on Fibonacci in isolation.
Trading disclaimer: Trading involves risk. This article is for educational purposes only and is not financial advice. Technical analysis tools do not guarantee profitable results. Past performance is not indicative of future results. Always manage your risk appropriately.
