How to Use Multiple Charts in TradingView (Layouts & Advanced Workflow Guide)
This article contains affiliate links. If you sign up for TradingView through a link on this page, I may earn a commission at no extra cost to you. I only recommend tools I have genuinely evaluated.
Trading involves risk. Technical analysis tools do not guarantee profitable results. Past performance is not indicative of future results. Always manage your risk appropriately.
If you have ever caught yourself flipping between timeframes trying to hold two charts in your head simultaneously — or missed an entry because you were on the wrong chart at the wrong moment — TradingView’s multi-chart layouts will immediately change your workflow. This feature is the single most cited reason active traders upgrade beyond the Basic plan, and for good reason: seeing your daily, 4H, and 1H charts simultaneously is a fundamentally different analytical experience from switching between tabs.
The setup itself takes under two minutes. The question that actually matters is how to structure those charts in a way that improves your analysis and decision-making rather than just adding visual clutter to your screen. More charts does not automatically mean better trading. The right chart structure, used with a clear workflow, does.
After 30 years in finance, I approach multi-chart layouts the same way I approach any analytical system: the goal is to reduce cognitive load and improve decision speed, not to display more data. In practice, what I have consistently found is that traders who move to a 3-chart top-down layout reduce hesitation on entries significantly — because the higher timeframe context is always visible, there is no mental gap between forming a bias and acting on it.
If you do not yet have a TradingView account, you can get started on the Basic free plan and follow this guide. Get started with TradingView here.
Quick Answer
To use multiple charts in TradingView: click the layout icon in the top right of the chart interface (the grid symbol), select your preferred chart grid — 2, 4, 8, or up to 16 charts depending on your plan — then assign a different asset or timeframe to each panel. Each chart operates independently with its own indicators, timeframe, and symbol unless you enable sync options. The Basic free plan is limited to one chart — multiple charts require a paid plan starting from Essential (2 charts) through Ultimate (up to 16 charts). The most immediately useful setup is a 3-chart layout showing the daily, 4H, and 1H timeframes for the same asset simultaneously.
TradingView Multi-Chart Layouts: Plan Limits at a Glance
Before configuring a layout, check your plan limit — there is no point building a 4-chart setup if your plan only supports 2.
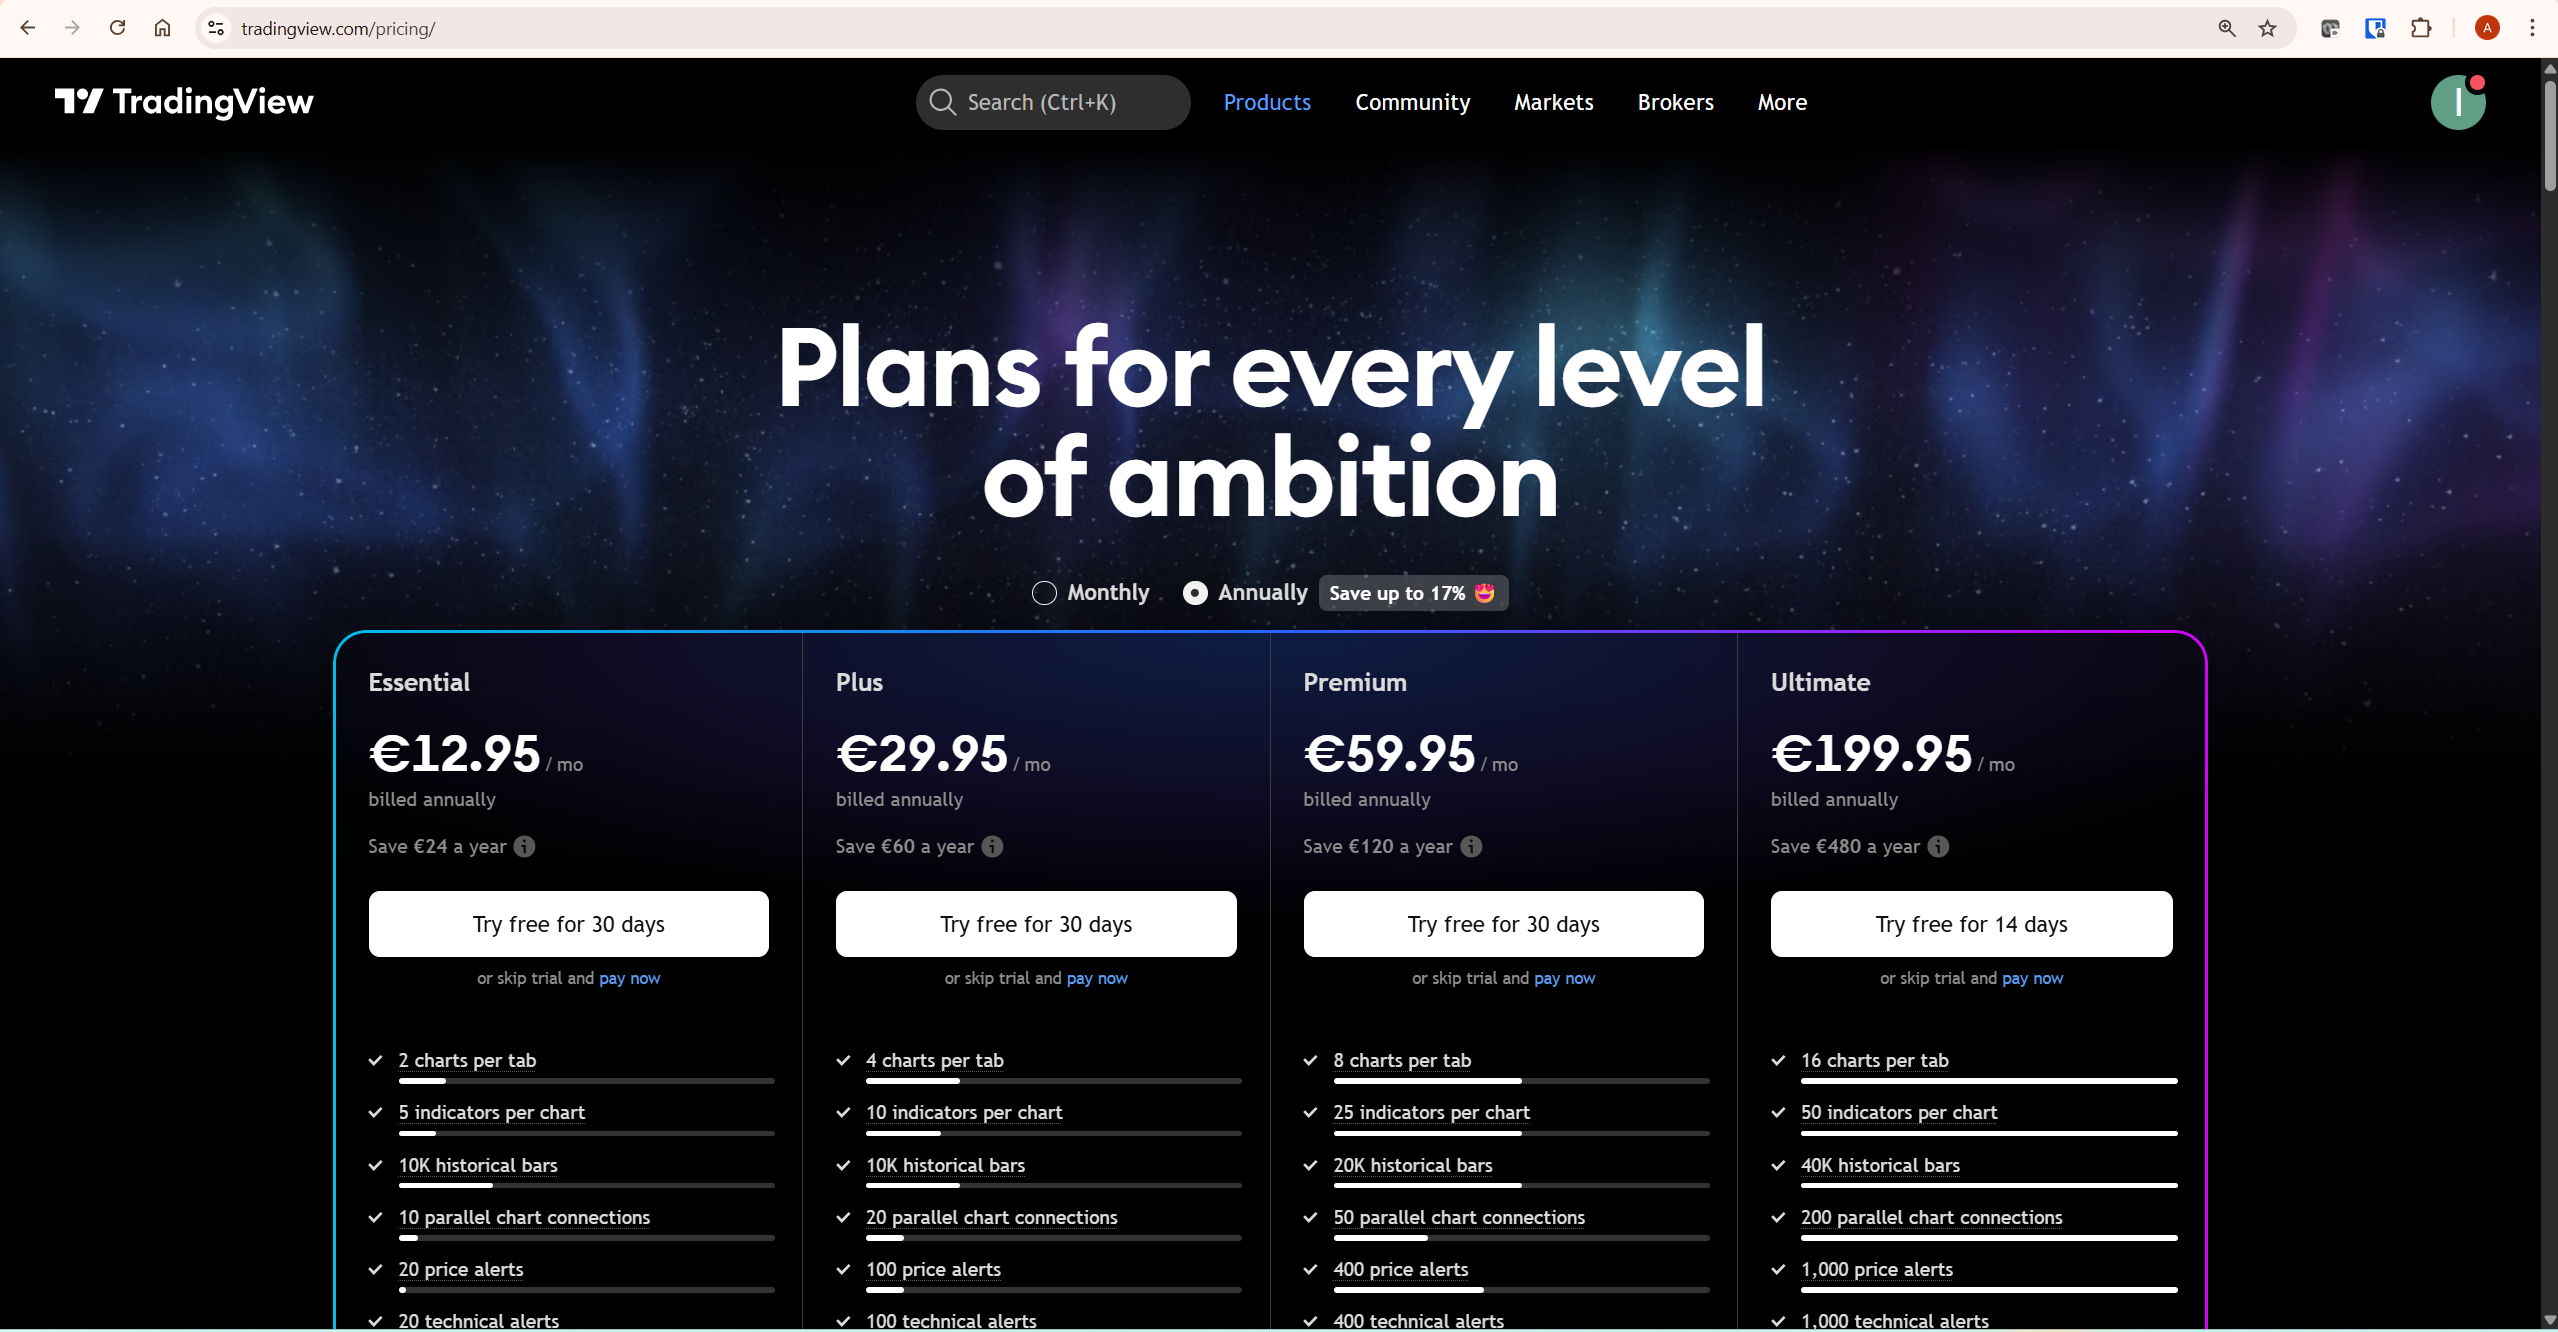
| Plan | Charts Per Tab | Best For | Verdict |
|---|---|---|---|
| Basic (free) | 1 chart only | Learning the platform | No multi-chart access |
| Essential | 2 charts | Simple trend + execution setup | Entry level — workable |
| Plus | 4 charts | Full top-down multi-timeframe | Best value for active traders |
| Premium | 8 charts | Multi-asset correlation monitoring | For serious traders |
| Ultimate | 16 charts | Professional multi-asset monitoring | Institutional level |
For most crypto traders running a structured multi-timeframe workflow, the Plus plan with 4 charts is the practical sweet spot — daily, 4H, 1H, and one context chart covers everything needed. For a full breakdown of plan differences beyond chart limits, our TradingView free vs paid guide covers every feature difference in detail.
Why Single-Chart Analysis Costs You Entries
Single-chart analysis has one fundamental limitation: every time you switch timeframes, you lose the context of the previous view.
You might check the daily chart, form a directional bias, switch to the 4H to assess structure, then move to the 1H to time your entry — but by the time you get to the entry chart, the broader context has faded. That cognitive switching cost is not trivial. It produces hesitation, missed entries, and second-guessing that would not exist if all three views were visible simultaneously.
When your daily, 4H, and 1H charts are all visible at once, trend alignment — or misalignment — is instant. A breakout on the 1H that contradicts the daily trend is immediately obvious. A confluence of support levels across multiple timeframes is visible in a single glance rather than requiring three separate tab switches and a mental effort to hold all the information together.
For crypto traders specifically, simultaneous timeframe analysis solves the correlation monitoring problem too. Bitcoin’s price movement influences the entire crypto market — knowing whether your altcoin trade is occurring while BTC is at a key resistance level versus in a strong uptrend is meaningful information. A layout that keeps BTC visible alongside your primary trading asset provides that context automatically, without any additional tab management.
For a complete overview of TradingView’s platform and all its major features, our TradingView review covers everything from charting tools to pricing in detail.
Step-by-Step: Setting Up Multiple Charts in TradingView
The setup takes under two minutes once you know where the controls are. Here is the exact sequence.
Step 1: Open the Layout Selector
Log into TradingView and open your chart. In the top right area of the chart interface, look for the layout icon — it appears as a small grid of squares. Click it to open the layout selector panel. This is where you choose how many charts to display and how they are arranged on screen.
Step 2: Select Your Chart Grid
The layout selector shows all available grid configurations for your plan. Start with a 2 or 3-chart layout rather than jumping straight to the maximum — more charts means more to manage, and starting simple lets you build the workflow habit before adding complexity.
The three most practical configurations: 2-chart side-by-side for simple trend-plus-execution setups, 3-chart layout with one large chart and two smaller supporting charts for top-down analysis, and 4-chart 2×2 grid for full workflows covering daily through 1H with a context chart.
Step 3: Assign Assets and Timeframes
Click on each chart panel and set the asset and timeframe independently. For a standard top-down setup: chart 1 on the daily timeframe, chart 2 on the 4H, chart 3 on the 1H, chart 4 on BTC daily if you are trading altcoins. Each panel accepts its own indicator set — keep higher timeframe charts indicator-light (EMAs and RSI only) and reserve the lower timeframe charts for your entry-timing indicators.
A real example of how this plays out in practice: Daily chart shows BTC in a clear uptrend above the 200 EMA. The 4H shows a pullback to the 50 EMA — a potential entry zone. The 1H shows a bullish engulfing candle forming at that level. All three timeframes align — this is a confirmed entry signal that would have required three separate tab switches to identify without the side-by-side layout.
Step 4: Configure Sync Settings
Crosshair sync is the most powerful option for top-down analysis — hovering over a specific point in time on your 4H chart immediately shows the corresponding position on all other panels simultaneously.
The recommended configuration: enable crosshair sync, disable timeframe sync. This lets each chart maintain its independent timeframe while the crosshair ties them together spatially. Symbol sync is useful for traders who scan multiple assets — changing the symbol in one chart updates all synced charts automatically.
Step 5: Save Your Layout
Once your setup is configured correctly, save it using the layout name field at the top of the screen. Save multiple named layouts for different scenarios: a swing trading layout, a day trading layout, a market monitoring layout. Switching between them takes one click — your full analytical environment loads instantly at the start of each session rather than being rebuilt from scratch.
The Four Most Useful Layout Structures
The technical setup is straightforward — the more important question is which structure to use for your specific trading style.
The Top-Down Multi-Timeframe Layout (3–4 charts) is the most universally useful structure. Daily chart for overall trend direction, 4H for market structure and swing high/low identification, 1H for entry refinement. This structure ensures every trade decision has higher timeframe context built in — which is the single most effective structural improvement most retail traders can make to their analysis process.
The Trend and Execution Layout (2 charts) is the simplest practical entry point for traders just upgrading from Basic. One large chart showing daily or 4H trend context, one chart showing 1H or 15M execution timeframe. This two-chart setup eliminates the most costly single-chart error — taking entries without checking whether the higher timeframe trend supports the trade direction.
The Correlation Monitoring Layout (4 charts) is specifically for crypto traders who need market-wide context. Chart 1: BTC daily for overall market direction. Chart 2: ETH daily as a secondary health indicator. Chart 3: your primary trading asset on the 4H. Chart 4: total crypto market cap or BTC dominance index. This layout tells you immediately whether your altcoin trade has a market tailwind or headwind — information that is genuinely predictive of trade outcome.
The Indicator Testing Layout is for strategy development — the same asset on the same timeframe across multiple charts but with different indicator configurations, letting you compare signal quality side by side. This is one of the most productive ways to evaluate whether a new indicator or setting change actually improves your analysis rather than relying on backtesting alone.
For setting alerts on the key levels you identify across your layout, our TradingView Alerts guide covers exactly how to configure notifications that fire when price reaches those levels — so you do not need to watch charts continuously.
Using Multiple Charts for Risk Management
Side-by-side chart layouts are one of the most underused risk management tools available to retail traders — and arguably more valuable for protecting capital than for finding entries.
The most common risk management error in single-chart trading is placing stops based on lower timeframe structure without checking whether higher timeframe support or resistance zones are nearby. A stop that looks correctly placed below a 1H support level may actually sit right inside a major 4H or daily support zone — meaning the stop is far too tight for the timeframe structure that actually matters.
The fix: before finalising any stop placement, visually check the higher timeframe chart in your layout to confirm your stop does not sit inside a major support or resistance zone. If it does, either widen the stop to account for the higher timeframe level or skip the trade — the risk profile is worse than it appears on the single execution chart.
The same principle applies to targets. A take-profit level that looks open on the 1H may sit directly below a significant daily resistance level that will likely cap the move. Seeing both timeframes simultaneously makes these conflicts obvious before you enter, rather than discovering them after the trade has reversed unexpectedly.
For a complete guide on the indicators that work best within this kind of setup, our best TradingView indicators for crypto trading guide covers RSI, EMA, and MACD with specific settings recommendations for each timeframe.
Common Mistakes With Chart Layout Setups
These are the specific errors that prevent traders from getting the analytical improvement they expected when they first switch to a multi-panel setup.
Overloading every chart with different indicators. Eight indicators on chart one, seven on chart two, six on chart three — each panel telling a different story with no coherent analytical framework connecting them. The result is more confusion, not less. Keep indicator setups consistent and minimal. If you use RSI and EMAs on the 4H, use the same on the daily and 1H. Consistency across timeframes is what produces clear signals.
Monitoring too many assets simultaneously. Displaying eight different assets across eight charts does not make you eight times more informed — it makes you eight times more distracted. Start with one primary asset across multiple timeframes. Add a second asset only when your workflow for the first is fully systematised.
Switching layouts constantly rather than developing one deeply. Effective top-down analysis requires committing to a structure long enough to develop real pattern recognition within it. Traders who redesign their layouts every week never build the spatial familiarity that makes chart analysis fast and intuitive. Choose a structure, use it for at least four weeks, and evaluate whether it is genuinely improving your trading before making changes.
Ignoring the highest timeframe chart. Always ensure your highest timeframe chart is the first thing you look at when opening a layout, and treat it as the frame that all lower timeframe analysis must agree with before you act.
Is Upgrading for Multiple Charts Worth It?
The decision of whether to upgrade is worth addressing directly rather than leaving it implied.
For casual traders who check prices occasionally and do not follow a structured technical analysis process, upgrading purely for this feature is probably not worth it at this stage. The Basic free plan is genuinely useful for learning the platform, and adding more charts to an unstructured workflow adds complexity without adding value.
For active crypto traders who already use top-down analysis — even if currently doing it by switching tabs manually — the upgrade pays for itself quickly. The efficiency gain from seeing your daily, 4H, and 1H charts simultaneously is real and immediate. The specific milestone at which upgrading makes sense: when you are regularly consulting more than one timeframe before making trading decisions and finding the tab-switching process disruptive to your flow.
According to Investopedia’s guide on multiple timeframe analysis, analysing the same asset across different time periods is one of the most reliable methods for improving trade timing — which is exactly what TradingView’s side-by-side chart layouts enable in practice.
Explore TradingView’s plan options here.
What To Do Next
If you are on a paid plan, do this today — it takes ten minutes:
Open TradingView and click the layout icon in the top right of your chart. Select a 3-chart layout. Set chart 1 to your primary trading asset on the daily timeframe. Set chart 2 to the same asset on the 4H. Set chart 3 to the same asset on the 1H. Apply the same two indicators to all three charts — a 50 EMA and RSI is enough to start. Enable crosshair sync in the sync settings. Save the layout as “Multi-TF Setup”.
Use that layout for your next five trading sessions without changing anything. Assess at the end of the week whether the simultaneous timeframe visibility changed the quality of your entry decisions. For most traders who make this switch, the answer is yes — and from there, refining the setup and adding a fourth context chart is a natural next step.
For a complete picture of everything TradingView offers — charting tools, indicators, alerts, Pine Script, and paper trading — read our full TradingView review.
Frequently Asked Questions
Can I use multiple charts on TradingView’s free plan?
No — the Basic free plan is limited to one chart per layout. Multiple charts require a paid plan starting from Essential, which unlocks 2 charts per tab. TradingView occasionally offers free trial periods on paid plans — worth checking before committing to a subscription.
How many charts can I display simultaneously on TradingView?
Essential allows 2 charts per tab, Plus allows 4, Premium allows 8, and Ultimate allows up to 16. For most active traders, 4 charts on the Plus plan covers everything needed for a complete top-down workflow. The higher-tier layouts are primarily useful for traders monitoring multiple assets or correlation pairs simultaneously rather than purely for timeframe analysis of a single asset.
Can I save multiple chart layouts in TradingView?
Yes — you can save multiple named layouts and switch between them instantly. This means you can have a dedicated swing trading layout, a day trading layout, and a market monitoring layout, each pre-configured with the relevant assets, timeframes, and indicators — ready to load with a single click at the start of each session.
Does syncing charts in TradingView affect performance?
Crosshair sync and symbol sync add minimal processing load and are not meaningfully performance-impacting on modern hardware. The one area where performance can degrade is adding too many complex indicators across too many charts simultaneously — particularly custom Pine Script indicators. Keeping indicator loads moderate across each panel maintains smooth performance even on 4-chart layouts.
What is the best chart layout for crypto trading?
The 3-chart top-down setup is the most practical starting point for crypto traders: daily chart for trend direction, 4H for market structure, 1H for entry timing. If you have access to 4 charts on the Plus plan, add BTC on the daily as a market context chart alongside your primary trading asset. This gives you both timeframe depth and market correlation in a single view — which covers the two most common gaps in single-chart crypto analysis.