
TradingView Strategy Tester: Best Complete Guide for Traders (2026)
Affiliate Disclosure: This article contains affiliate links. If you sign up for TradingView through a link on this page, I may earn a commission at no extra cost to you. I only recommend tools I have genuinely evaluated.
Most TradingView strategy backtests are lying to you — and the platform is not to blame. The default settings assume zero commission, zero slippage, and perfect order fills on every trade. Apply any strategy with those defaults and the results will look far better than anything achievable in live trading. The traders who get burned are not the ones who ignore the Strategy Tester — they are the ones who trust it without understanding what it actually measures.
Having used professional trading tools and systematic analysis frameworks across 30 years in finance, I can tell you that backtesting discipline is one of the most consistently misunderstood skills in retail trading. The TradingView Strategy Tester is a genuinely useful tool when configured correctly and interpreted honestly. I am Andreas Maratheftis, founder of InnovateHub Finance. This guide covers exactly what you need: how to open the Strategy Tester, what the metrics actually mean, the three settings you must change before trusting any result, and the mistakes that produce misleading outputs. If you do not yet have a TradingView account, you can start for free here — the free plan includes full access to the Strategy Tester.
Quick Answer
The TradingView Strategy Tester is a built-in backtesting engine that simulates how a Pine Script strategy would have performed on historical data. Access it by applying a strategy script to a chart — the Strategy Report panel appears in the bottom area once the strategy is active. Before trusting any result, check the Properties tab: set Commission to your broker’s actual rate, set Slippage to a realistic number of ticks, and set Initial Capital and Order Size to reflect how you would actually trade. Many strategies use default or unrealistic cost assumptions unless you configure the Properties manually — and default settings can materially overstate performance, especially for strategies that trade frequently or use tight stops.
What the TradingView Strategy Tester Actually Is
The TradingView Strategy Tester is not a standalone tool — it is a panel that activates automatically when you apply a strategy script to a chart. Understanding this distinction is the first step to using it correctly.
TradingView has two types of scripts: indicators and strategies. Indicators plot visual data on your chart — lines, signals, oscillators. Strategies do everything an indicator can do, but they also simulate buy and sell orders and generate a performance report. If you add a script to your chart and the Strategy Report panel does not appear at the bottom, you have added an indicator, not a strategy. According to TradingView’s official strategy documentation, when a strategy is applied, executed orders appear directly on the chart as arrows and the Strategy Report panel populates with performance metrics.
The Strategy Tester runs in two modes simultaneously. Backtesting calculates the strategy against all historical data loaded on the chart. Forward testing continues the calculation in real time as new bars close. Both happen automatically whenever a strategy is active on the chart.
How to Open the Strategy Tester
Opening the TradingView Strategy Tester takes three steps. First, go to any chart in TradingView Supercharts. Second, click Indicators at the top of the chart and search for a strategy — look for results with a strategy icon rather than an indicator icon. TradingView’s built-in strategies include Supertrend Strategy, Moving Average Cross, and RSI Strategy among others. Third, click the strategy to apply it. The Strategy Report panel will appear in the bottom area of the screen.
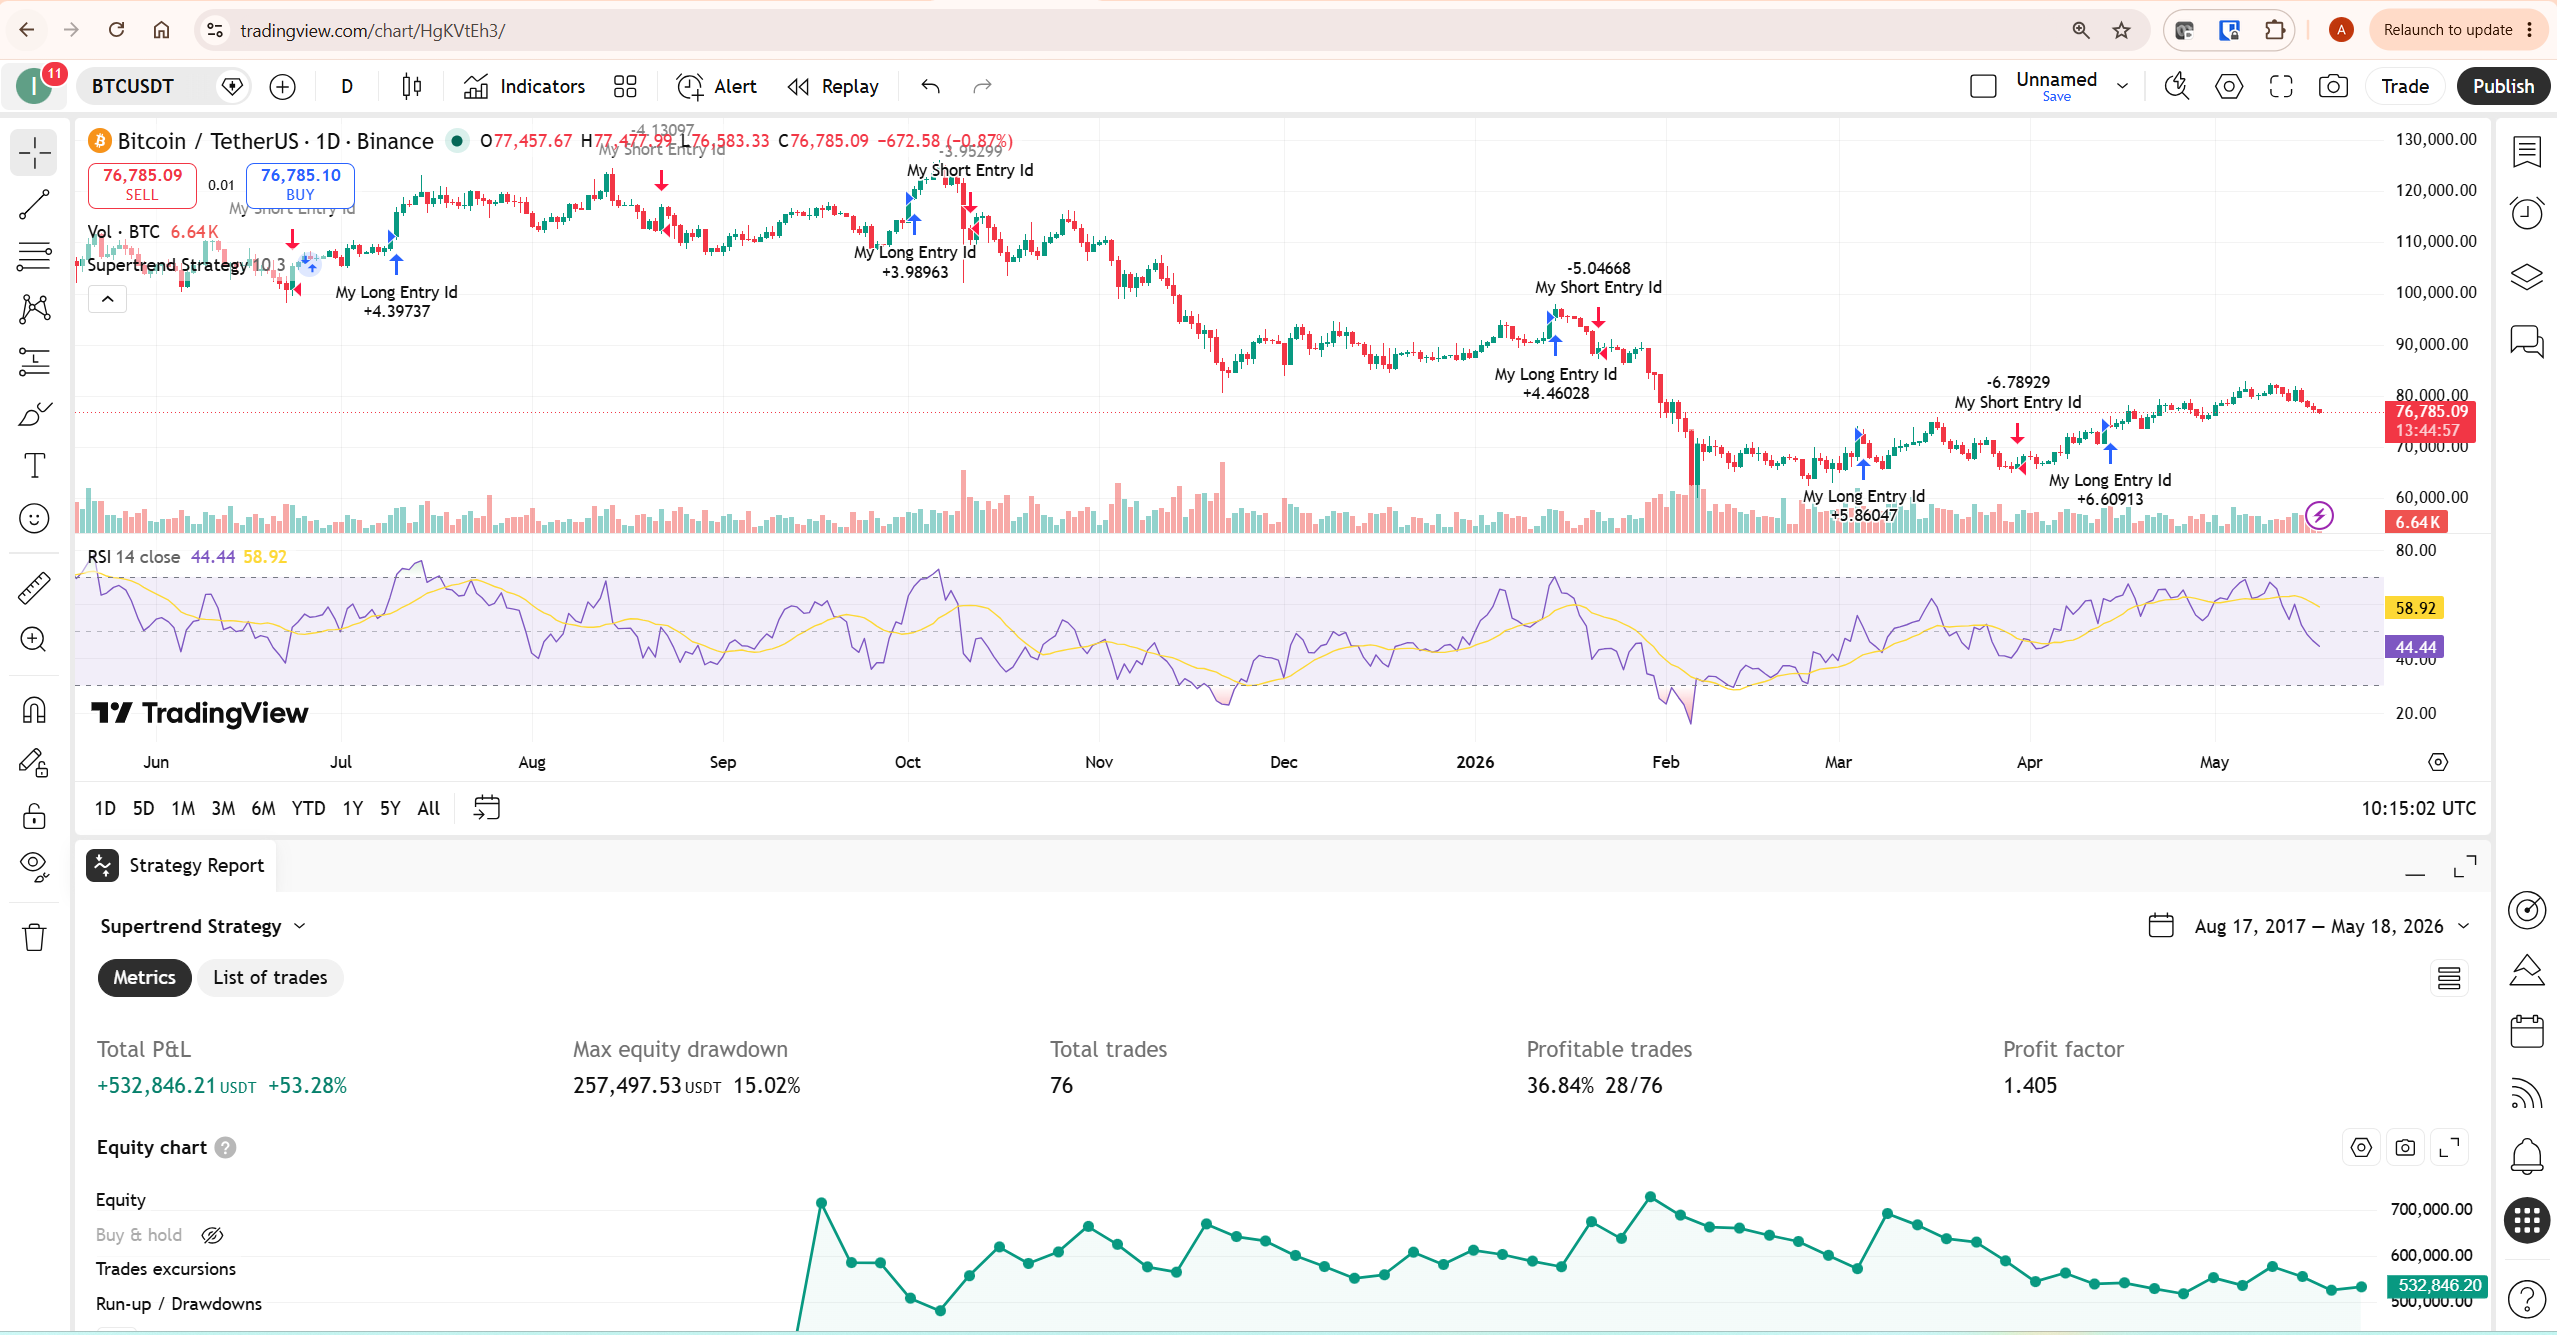
You can also access community strategies through the Indicators panel by switching to the Community Scripts tab and filtering for strategies. TradingView has 100K+ community-powered scripts and indicators, although only those declared as strategies — not indicators — will activate the Strategy Tester. For a full overview of TradingView’s capabilities beyond backtesting, our TradingView review covers the complete platform.
Understanding the Strategy Report: Two Sections Explained
The Strategy Report has two main sections — Metrics and List of Trades. Each serves a different purpose in evaluating a strategy’s historical performance.
Metrics Section
The Metrics section is the primary performance summary. At the top you see the five most important numbers at a glance: Total P&L, Max equity drawdown, Total trades, Profitable trades percentage, and Profit Factor. Below these summary figures are three visual charts: a bar chart showing the breakdown of total profit, open P&L, total loss, commissions paid, and net P&L; an equity curve chart showing account balance progression across all simulated trades; and a comparison chart showing strategy P&L versus buy-and-hold P&L over the same period.
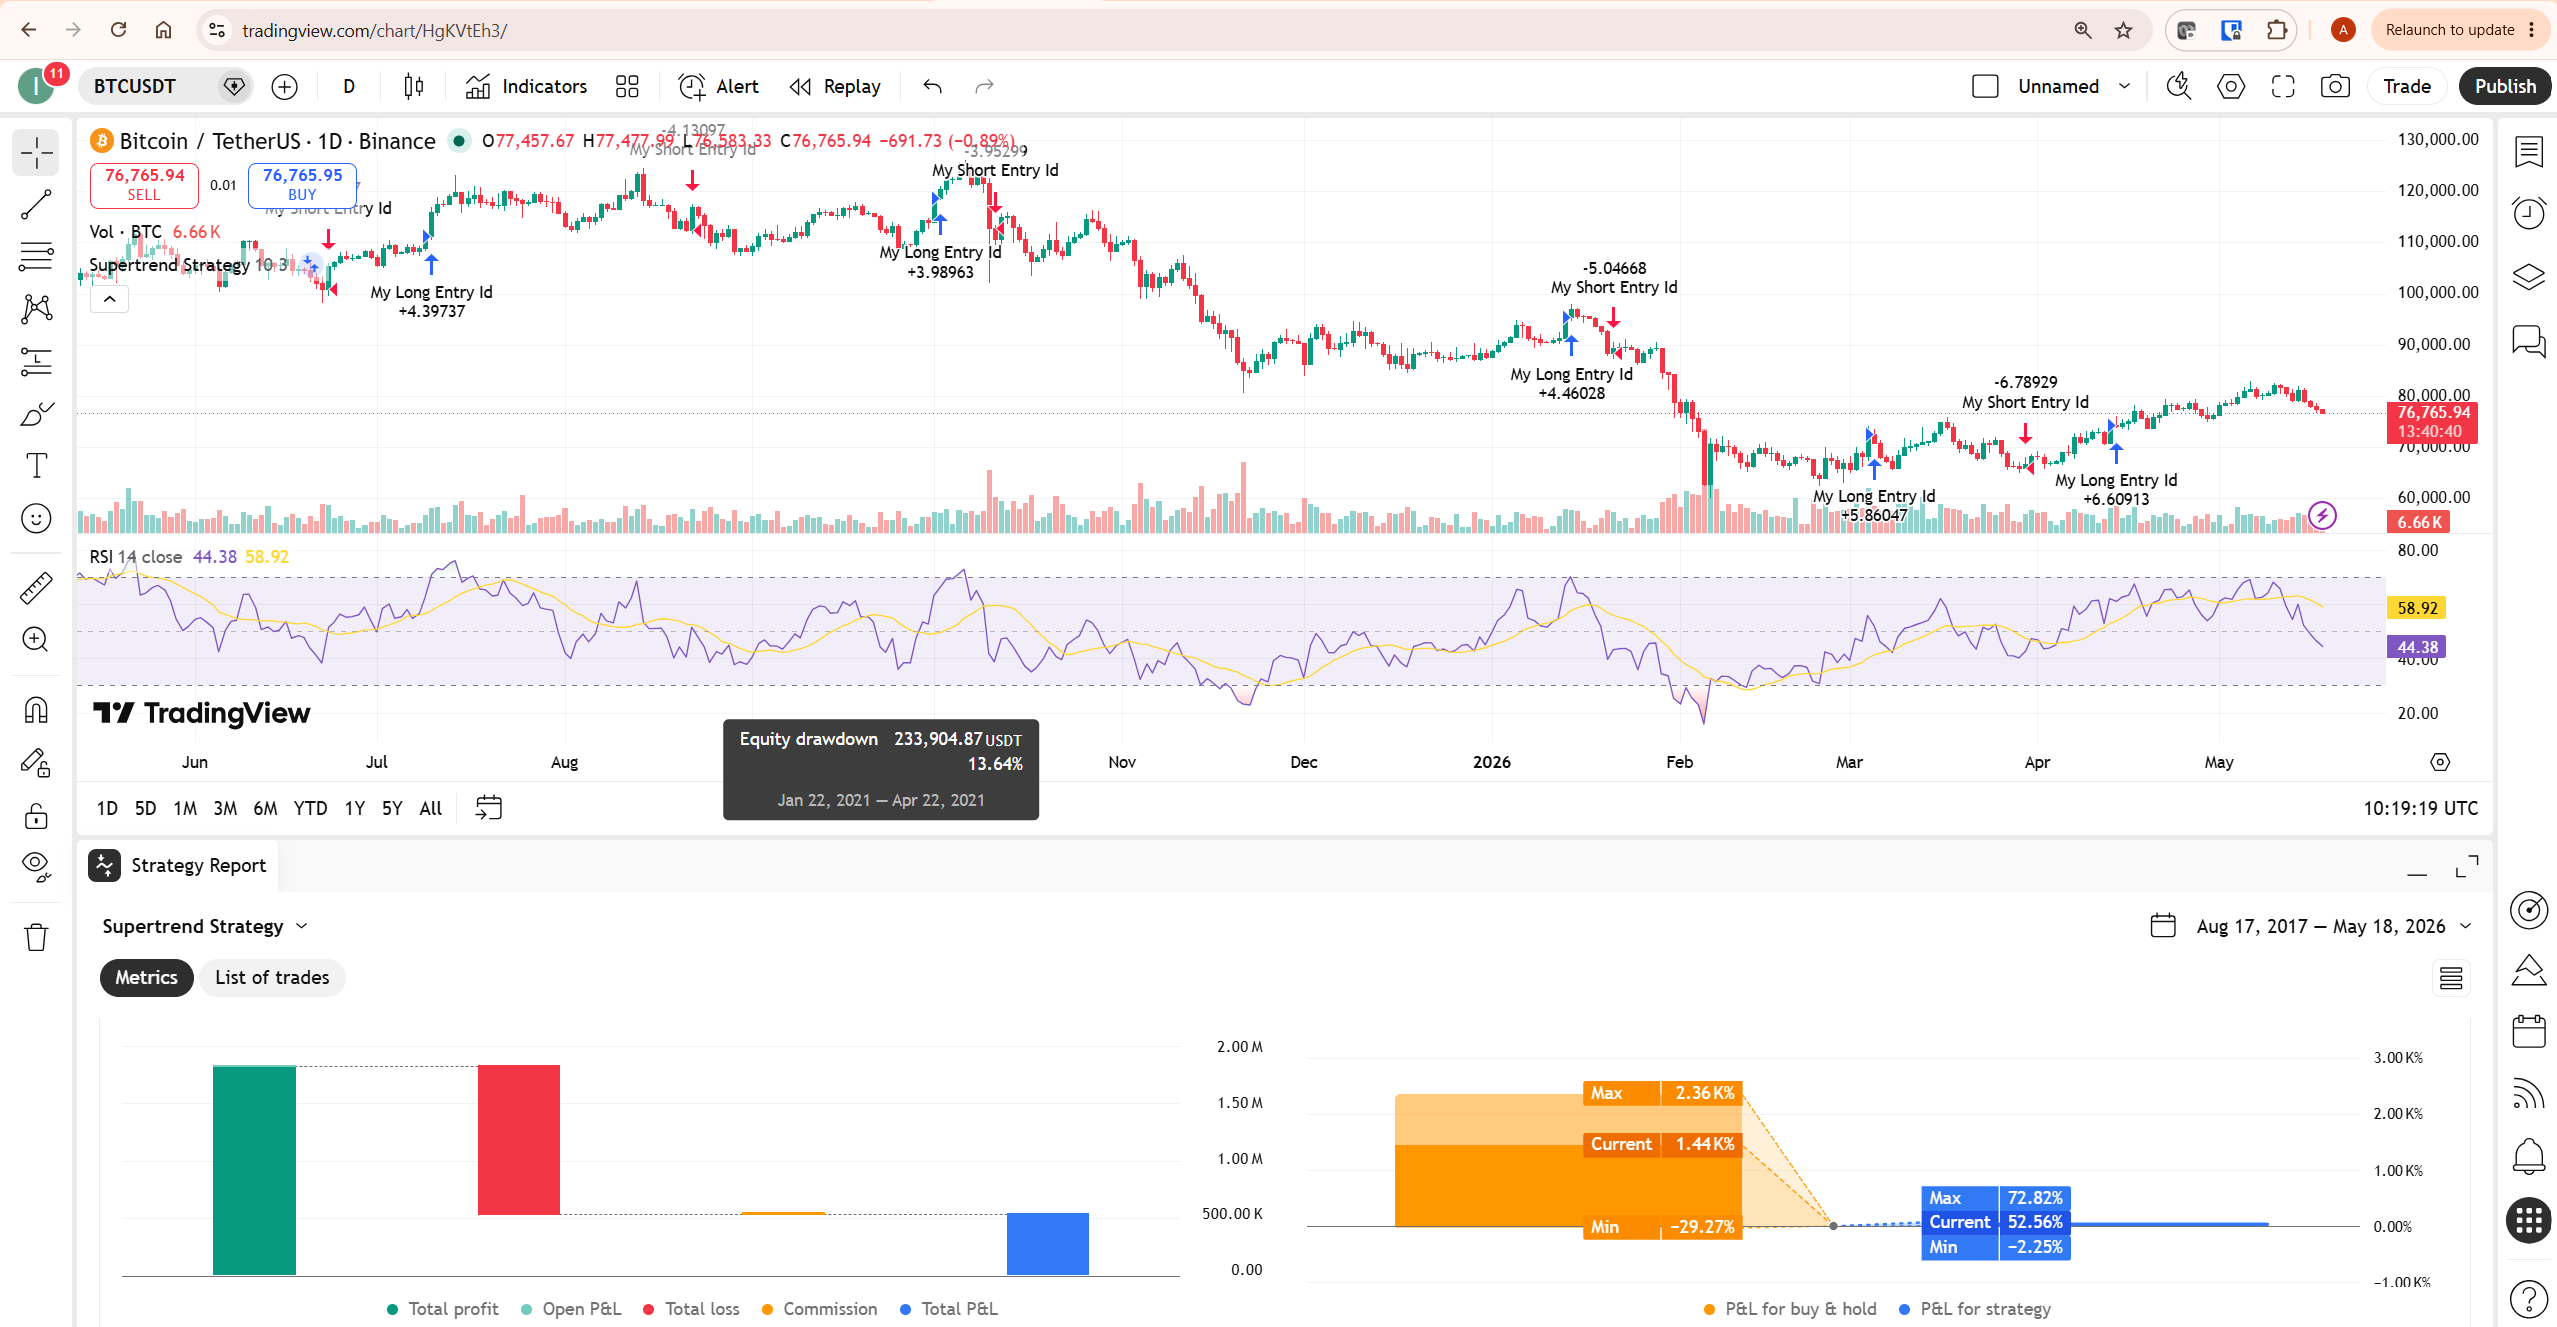
The buy-and-hold comparison chart is one of the most honest features of the TradingView Strategy Tester. It shows whether your strategy is actually adding value over simply holding the asset. A strategy that returns +50% on Bitcoin over three years while buy-and-hold returned +200% over the same period is not a good strategy — the comparison chart makes this immediately visible. Many backtests that look impressive in isolation look mediocre when placed next to the buy-and-hold baseline.
List of Trades Section
The List of Trades section shows every simulated trade in chronological order — entry date, exit date, entry price, exit price, quantity, profit in absolute terms, and profit as a percentage. This section is essential for identifying patterns in your strategy’s performance that the summary metrics obscure.
Scroll through the trade list looking for three things. First, are profits clustered in one specific time period? A strategy that made all its gains in 2020–2021 and has been flat or negative since is a market regime problem — it only works in bull markets. Second, are the losing trades much larger than the winning trades? A 60% win rate looks good until you realise the average loss is three times the average win. Third, how many trades are there total? A result from fewer than 30 trades is usually too thin to rely on. A larger sample — ideally 100 or more trades across different market regimes — gives a more meaningful picture.
The Three Settings You Must Change Before Trusting Any Backtest
This is the most important section in this guide. Default TradingView Strategy Tester settings can materially overstate performance — particularly for strategies that trade frequently, use tight stops, or operate in less liquid markets. The reason is straightforward: by default, commission is set to zero and slippage is set to zero. Even where a broker advertises zero commission, real trading can still involve spreads, execution differences, financing costs, exchange fees, or slippage. A zero-cost, perfect-fill assumption should never be accepted without checking how you would actually trade.
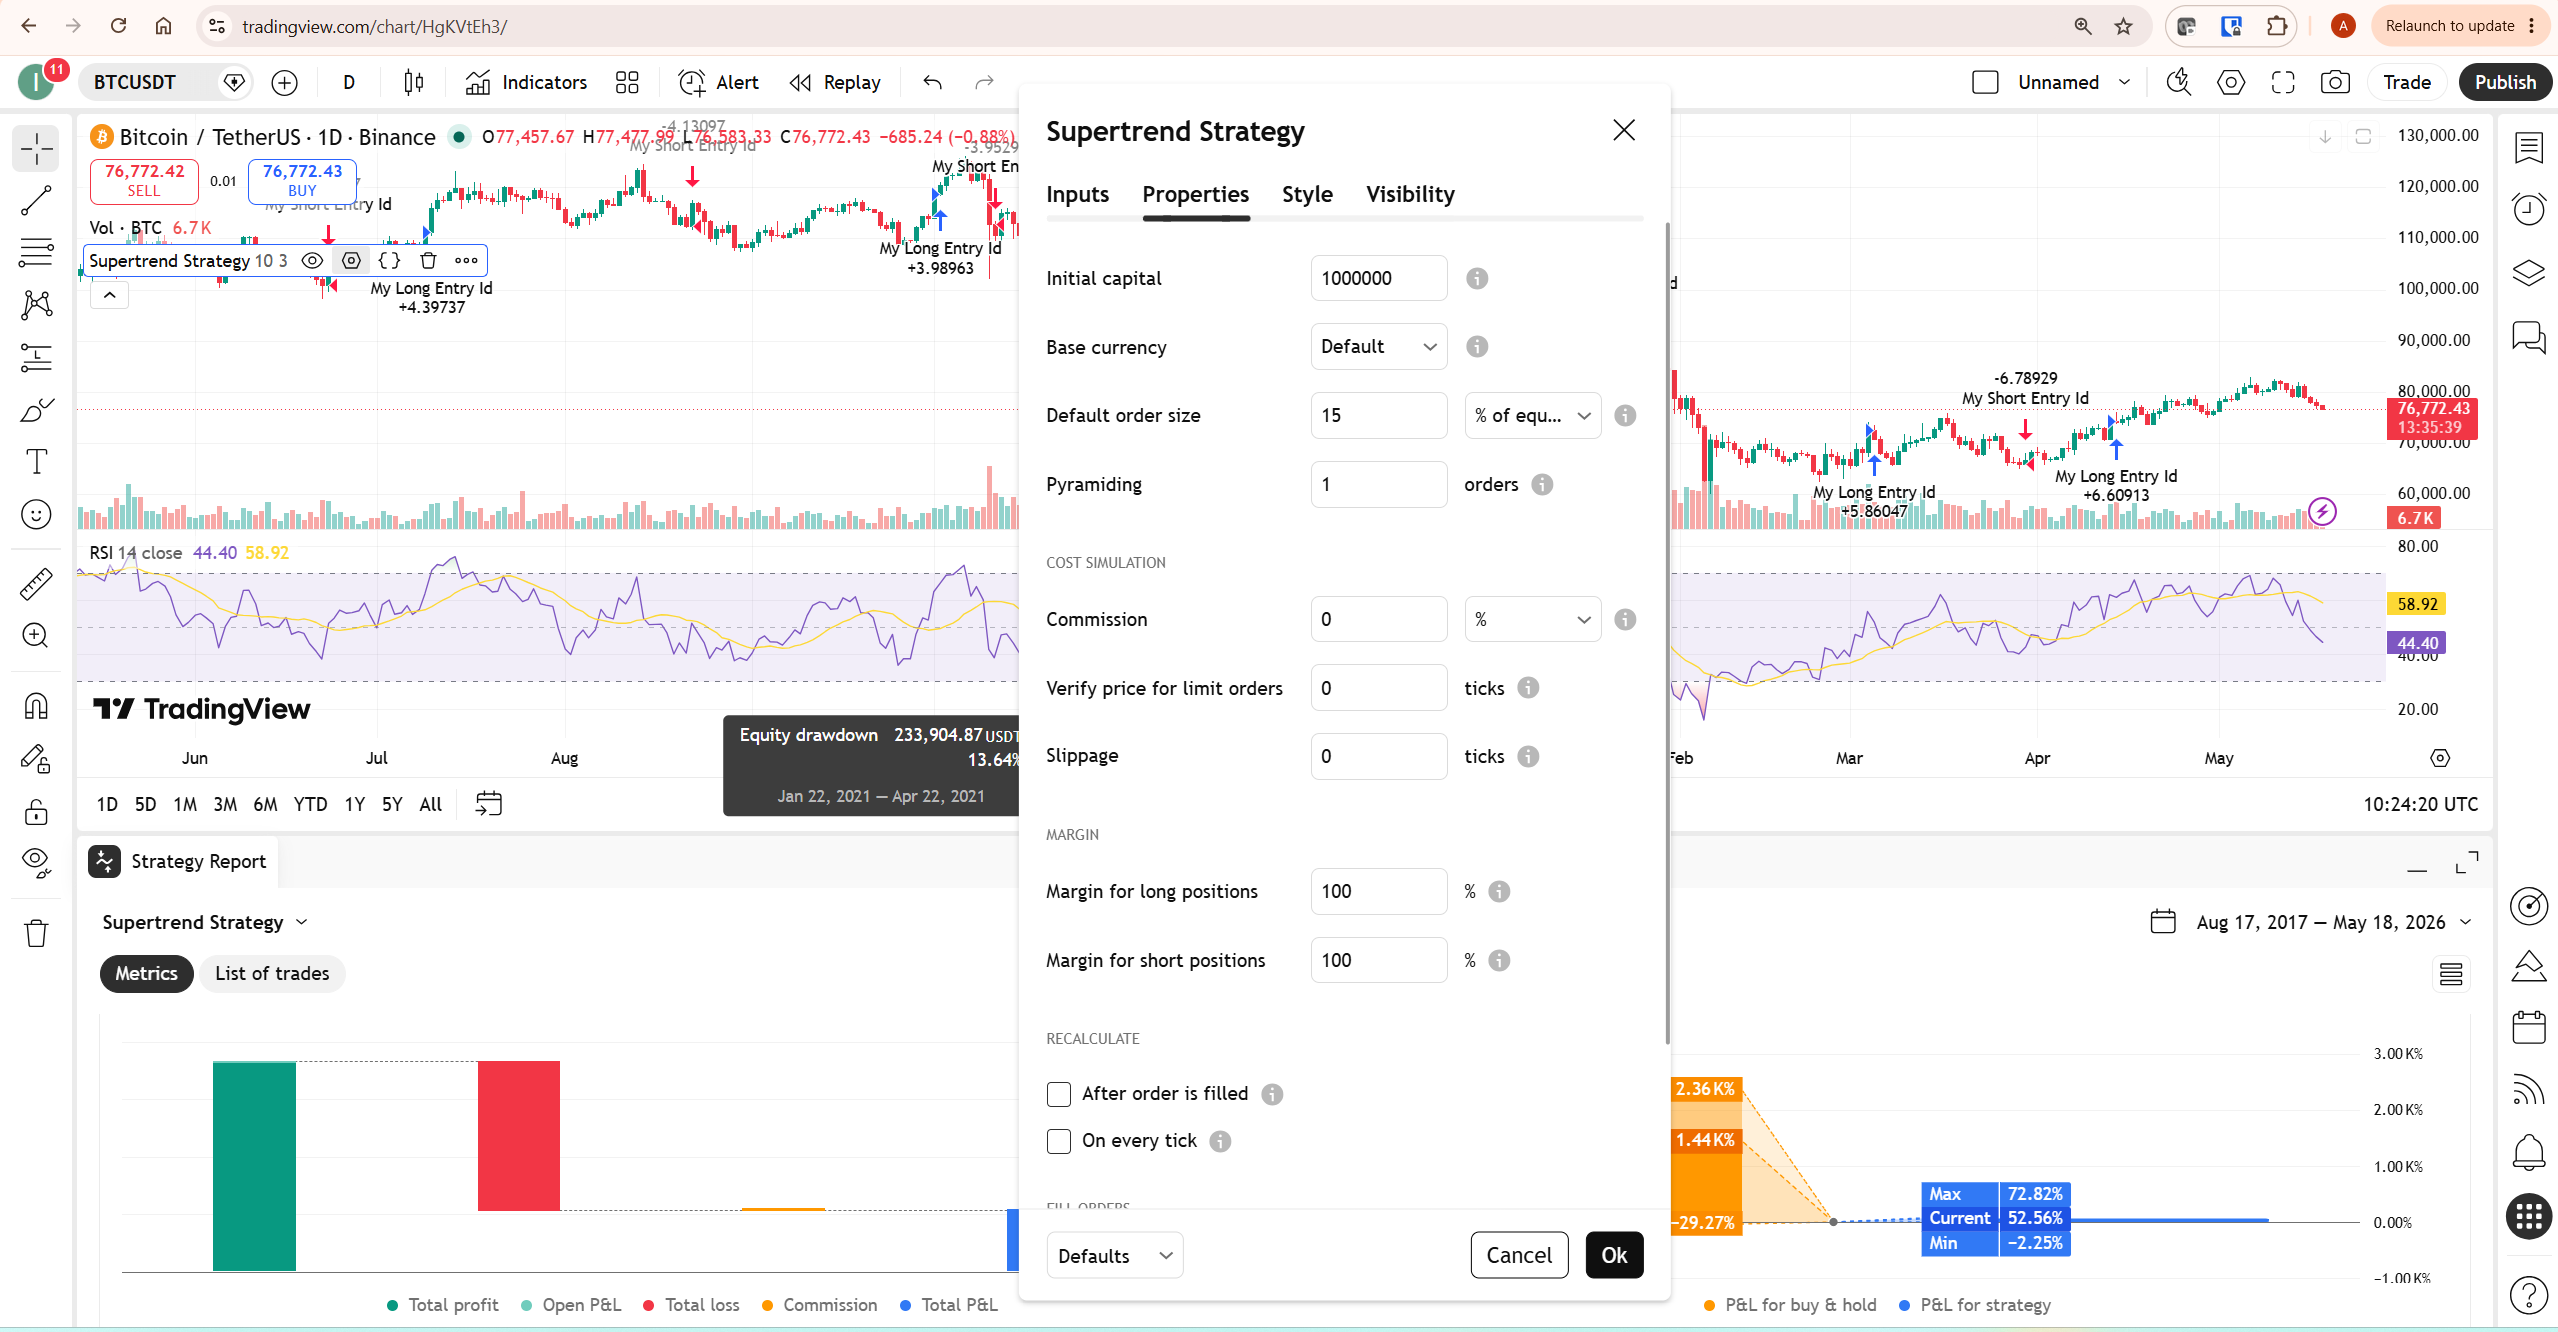
To access these settings, hover over the strategy name in the top left of your chart, then click the gear icon that appears. Select the Properties tab. Here are the three changes to make immediately.
Setting 1 — Commission: Change from 0 to your broker’s actual rate. For crypto spot trading on Binance, use 0.1% per side (taker rate). For crypto perpetual futures, use 0.04%–0.055% depending on your exchange. For forex, convert your broker’s average spread to a percentage — typically 0.02%–0.06% for major pairs. The impact depends heavily on trade frequency and position sizing. For example, a strategy making 200 round-trip trades per year where each trade uses the full account would pay approximately 40% of account equity in commissions annually at 0.1% per side. With 5% position sizing per trade, the drag is 2% annually — significant but far lower. The more frequently your strategy trades, the more commission assumptions matter.
Setting 2 — Slippage: Change from 0 to 1–3 ticks depending on the asset’s liquidity. Slippage represents the difference between the price at which your strategy signals a trade and the price at which it actually fills. On liquid assets like BTC/USDT on Binance, 1–2 ticks is a realistic assumption. On less liquid assets or during volatile market conditions, 3–5 ticks is more appropriate. Zero slippage assumes perfect fills at the exact signal price — an assumption that never holds in live trading.
Setting 3 — Initial Capital: Set this to an amount that reflects your actual intended trading capital. If you plan to trade with $10,000, set initial capital to $10,000 and set order size to a fixed percentage of equity — typically 1%–5% per trade depending on your risk tolerance. This ensures that dollar profit figures in the backtest are proportional to your actual account size.
After making these changes, re-run the backtest and compare the result with the default version. The difference can be small for slow daily strategies with infrequent trades and severe for high-frequency or lower-timeframe strategies. This is why a realistic cost model is not optional — it is part of the backtest itself.
Key Metrics Explained: What to Look For
Once your settings are realistic, these are the metrics that matter most in the TradingView Strategy Tester and what each one actually tells you.
Profit Factor: Total gross profit divided by total gross loss. A Profit Factor above 1.0 means the strategy made more than it lost in aggregate. As a practical rule of thumb, many traders prefer to investigate strategies with a Profit Factor above 1.5 after realistic costs are included. Between 1.25 and 1.5 is marginal — workable but fragile. The Supertrend Strategy on BTC daily from 2017–2026 showed a Profit Factor of 1.405 with default zero-commission settings. Add realistic commissions and this number decreases.
Max Equity Drawdown: The largest peak-to-trough decline in the strategy’s simulated account balance. This is the number that tells you whether you could psychologically sustain this strategy in live trading. A 15% max drawdown on paper is very different from watching your real account drop 15% while wondering if the strategy has stopped working. If the max drawdown exceeds your personal risk tolerance, the strategy is not suitable for you regardless of its total returns.
Profitable Trades Percentage: The win rate. This number is meaningless without the average win size versus average loss size. A 40% win rate with an average win three times the average loss is a better strategy than a 70% win rate where the average loss equals the average win. Always look at win rate alongside Profit Factor — never in isolation.
Total Trades: The number of simulated trades in the backtest period. A result from fewer than 30 trades is usually too thin to rely on — the results could reflect random luck rather than a genuine edge. A more robust threshold is 100 trades across multiple market conditions. If your testing period only generates 20 trades on a daily chart, extend the test to a longer historical period or drop to a lower timeframe, accepting the reduced historical data depth that comes with shorter timeframes.
Deep Backtesting and Bar Limits: What Each Plan Provides
The amount of historical data available for backtesting depends on your TradingView plan. According to TradingView’s official historical data documentation, intraday bar limits by plan are: Basic — 5,000 bars; Essential and Plus — 10,000 bars; Premium — 20,000 bars; Expert — 25,000 bars; Ultimate — 40,000 bars. Daily and higher timeframes show all available data regardless of plan.
What these limits mean in practice: 5,000 hourly bars represents approximately 7 months of trading data. 5,000 five-minute bars represents less than three weeks. For traders testing intraday strategies on lower timeframes with a Basic plan, this bar limit is a genuine constraint that restricts testing to statistically thin sample sizes.
Deep Backtesting — available on Premium and higher plans — solves this by extending the Strategy Tester to use all available historical data for a symbol, up to 2 million bars and 1 million trades. According to TradingView’s official Deep Backtesting documentation, the feature calculates the strategy on all historical data available for the selected symbol and allows you to specify a custom date range. Deep Backtesting results appear in the Strategy Report but are not displayed on the chart itself.
Bar Magnifier — also available on Premium and higher plans — improves the accuracy of order fills during backtesting by using lower-timeframe data to simulate how a bar developed rather than making assumptions about intra-bar price movement. For strategies with tight stop-losses or take-profits, Bar Magnifier reduces the number of phantom trades that would not occur in live trading. For a complete breakdown of what each TradingView plan includes, our TradingView free vs paid guide covers every tier in detail.
Common Backtesting Mistakes to Avoid
The most common TradingView Strategy Tester mistake is trusting default settings. Commission at zero and slippage at zero are not conservative assumptions — they are fantasy assumptions that inflate every backtest result. Always configure realistic values before drawing any conclusions.
The second mistake is testing on non-standard chart types. Heikin Ashi, Renko, Line Break, Kagi, and Point & Figure charts use synthetic prices that do not reflect real market conditions. TradingView’s own documentation explicitly warns against using these chart types for backtesting. Always use standard candlestick charts for backtesting strategies.
The third mistake is testing over too short a period. A strategy tested on six months of data has seen one market condition. Test across at least three to five years covering both trending and ranging environments, bull and bear periods, and different volatility regimes before drawing any conclusions about a strategy’s edge.
The fourth mistake is ignoring the equity curve shape. A strategy with a smooth upward equity curve that generates consistent gains across different market conditions is fundamentally more reliable than a strategy where 80% of the profits came from two or three exceptional trades. Look at the equity curve shape, not just the total return number.
The fifth mistake is over-optimising inputs. Testing 200 parameter combinations and selecting the one with the best backtest result is not finding a robust strategy — it is curve fitting to historical data. Test parameters on one segment of historical data, then validate on a separate unseen segment. If performance degrades severely on the unseen data, the parameters are curve-fitted.
How the Strategy Tester Fits Into a Real Trading Workflow
The TradingView Strategy Tester is most valuable as a filter and a reality check — not as a profit predictor. Its job is to eliminate strategies that clearly do not work and to give you a realistic baseline expectation for the strategies that show promise.
A practical workflow: start with a strategy concept based on a logical market observation. Apply it using a built-in or community strategy script. Configure realistic commission and slippage settings. Run the backtest across five or more years of daily data. If the Profit Factor is below 1.25 or the max drawdown exceeds your risk tolerance with realistic settings, move on. If it passes, test it across multiple assets and timeframes to check for robustness.
After backtesting, forward testing is the next step: monitor the strategy signals in real time and compare actual signal behaviour against the historical report. TradingView’s Paper Trading simulator can then be used to practice execution without risking real capital — placing orders manually based on the strategy’s signals before committing live funds. For a complete guide to TradingView’s paper trading environment, our TradingView paper trading guide covers the full workflow. For traders who want to build their own strategies from scratch rather than using community scripts, our Pine Script tutorial covers the v6 language from the beginning.
What to Do Next
Open TradingView right now and apply the Supertrend Strategy to a BTC daily chart. Before looking at any metrics, go to the Properties tab and set Commission to 0.1% and Slippage to 2 ticks. Then look at the results. Compare them to what the default zero-commission settings showed. That difference is the reality gap — the distance between what most backtests claim and what live trading would actually deliver.
If you want to unlock Deep Backtesting and Bar Magnifier for more accurate intraday strategy testing, you can explore TradingView’s paid plans through our affiliate link.
Frequently Asked Questions
Is the TradingView Strategy Tester free to use?
Yes — the Strategy Tester is available on all TradingView plans including the free Basic plan. You can apply strategies, run backtests, and view all standard performance metrics at no cost. The features locked behind Premium and higher plans are Deep Backtesting (which extends historical data to all available bars for a symbol, up to 2 million bars) and Bar Magnifier (which improves intra-bar order fill accuracy). For daily-timeframe strategy testing, the free plan’s Strategy Tester is fully sufficient.
Why does my TradingView backtest not match my live trading results?
The most common cause is default settings. TradingView’s Strategy Tester defaults to zero commission and zero slippage — assumptions that do not reflect real trading conditions. Set Commission to your broker’s actual rate and Slippage to 1–3 ticks before drawing any conclusions. The impact on results depends on how frequently the strategy trades and how much of the account is committed per trade. Other causes include testing on too short a period, testing on non-standard chart types like Heikin Ashi, or over-optimised parameters that are curve-fitted to historical data.
What is a good Profit Factor in TradingView?
Profit Factor is total gross profit divided by total gross loss. A Profit Factor above 1.0 means the strategy made more than it lost in aggregate. As a practical rule of thumb, many traders prefer to investigate strategies with a Profit Factor above 1.5 after realistic costs are included. Between 1.25 and 1.5 is marginal. Always evaluate Profit Factor alongside Max Drawdown and Total Trades — a high Profit Factor from only 15 trades over 6 months is statistically unreliable.
What is Deep Backtesting on TradingView?
Deep Backtesting is a Premium and higher plan feature that calculates a strategy on all available historical data for a symbol — up to 2 million bars and 1 million trades — rather than only the bars currently loaded on the chart. This is particularly valuable for intraday strategy testing where the standard Strategy Tester’s bar limit restricts testing to weeks or months of data on lower timeframes. Deep Backtesting results appear in the Strategy Report but are not displayed on the chart itself.
Can I backtest on Heikin Ashi charts in TradingView?
Technically yes, but TradingView’s official documentation strongly advises against it. Heikin Ashi, Renko, Line Break, Kagi, and other non-standard chart types use synthetic prices that do not reflect real market conditions. Strategies backtested on these chart types produce unrealistic results because live orders execute at real market prices. Always use standard candlestick charts for backtesting.
How many trades does a backtest need to be statistically reliable?
A result from fewer than 30 trades is usually too thin to rely on. A more robust threshold is 100 or more trades across multiple market conditions — bull markets, bear markets, and ranging periods. For the most reliable results, aim for 200 or more trades covering different volatility regimes before drawing any conclusions. Our Pine Script tutorial covers how to build custom strategies that generate more signals for better statistical depth.
Conclusion
The TradingView Strategy Tester is one of the most valuable tools on the platform when used correctly — and one of the most misleading when used with default settings. In many strategies, the gap between a zero-commission backtest and a realistic one can be the difference between a system that appears profitable and one that actually has no tradable edge.
Set realistic commission and slippage before every backtest. Test across multiple market conditions over at least three to five years. Check the equity curve shape, not just the total return. Compare results to buy-and-hold. And treat backtest results as a filter for bad strategies, not a guarantee of future performance.
For a complete overview of TradingView’s analytical toolkit beyond the Strategy Tester, our TradingView review covers the full platform. To build your own strategies for testing, our Pine Script tutorial starts from scratch. To practice strategies in real-time without risking capital, our TradingView paper trading guide covers the complete simulation workflow. For active traders who rely on TradingView daily, TradingView’s paid plans unlock Deep Backtesting and Bar Magnifier for significantly more accurate strategy testing.
Trading involves risk. Backtesting results do not guarantee future performance. Past performance is not indicative of future results. Always manage your risk appropriately and never deploy a strategy in live trading based solely on backtest results.
