
How to Use TradingView Bar Replay: Complete Practice Guide
This article contains affiliate links. If you sign up for TradingView through a link on this page, I may earn a commission at no extra cost to you. I only recommend tools I have genuinely evaluated.
Trading involves risk. Technical analysis tools do not guarantee profitable results. Past performance is not indicative of future results. Always manage your risk appropriately.
TradingView Bar Replay is the specific tool that helps you practise historical price action without hindsight bias. If you have been studying chart patterns and technical setups but cannot identify them consistently in real time, Bar Replay turns historical data into a live training environment where you make decisions without knowing what happens next, building the pattern recognition and execution discipline that hindsight analysis cannot develop.
Most traders look at finished charts and draw conclusions from a position of complete information. Bar Replay removes that luxury and forces you to read price as it unfolds, candle by candle, exactly as you would in a live trading session. The difference in skill development between these two approaches is significant.
After 30 years in finance, I have seen traders spend months analysing completed charts and still struggle with live execution. Bar Replay is the bridge between knowing what a setup looks like and being able to act on it in real time. By the end of this guide, you will have a fully structured practice workflow — from activation through to multi-timeframe replay and paper trading integration.
TradingView provides Bar Replay access, but historical depth and replay availability can vary by symbol, timeframe, and plan. Get started with TradingView here.
Quick Answer: How to Use TradingView Bar Replay
To use TradingView Bar Replay: click the Bar Replay icon in the top chart toolbar (it looks like a play button), drag the vertical selector line to the historical point where you want to begin your replay, and click Play. All candles after your selected point are hidden — you now see only what a trader in that moment would have seen. Use the playback controls to advance candle by candle or play continuously at adjustable speed. The training value comes from making explicit entry, exit, and stop-loss decisions at each pause point before advancing to the next candle — not watching passively as price unfolds.
Bar Replay vs Strategy Tester vs Paper Trading: Which to Use When
TradingView has three distinct practice tools. Understanding which one to use prevents wasted practice time.
| Tool | Best For | Requires Coding? | Capital Risk? |
|---|---|---|---|
| Bar Replay | Manual pattern recognition and execution training on historical data | No | No |
| Strategy Tester | Automated backtesting of coded Pine Script strategies | Yes — Pine Script | No |
| Paper Trading | Simulated live trading with real-time price data | No | No |
Bar Replay is the right tool for discretionary traders who want to improve real-time pattern recognition and entry timing. The Strategy Tester is for algorithmic traders validating coded logic at scale. Paper Trading is for practising live execution on current market conditions. The most powerful combination is Bar Replay for historical pattern training plus Paper Trading for live execution practice — covering both dimensions of trading skill development.
What TradingView Bar Replay Is and Why It Matters
TradingView Bar Replay is a built-in historical replay tool that allows you to select any point in a chart’s history and replay price action forward from that point, candle by candle, with future price hidden. This is fundamentally different from reviewing a completed chart — when you look at a finished chart, you know where price went, which means your brain unconsciously interprets every indicator reading and price level through the lens of the outcome. This is hindsight bias, and it is the most significant distortion in self-assessed trading performance.
Bar Replay eliminates hindsight bias by creating genuine information uncertainty — you see what a trader at that historical moment would have seen, nothing more. This makes the decisions you make during replay psychologically closer to live trading decisions than any other form of chart study. Automated backtesting is useful for rule-based strategies, but discretionary traders also need manual practice because real trading decisions involve context, timing, and judgment that a coded test cannot capture. See Investopedia’s backtesting guide for the distinction between rule-based and discretionary validation approaches.
For a complete overview of TradingView’s full feature set including alerts, indicators, and multi-chart layouts, our TradingView review covers the platform in detail.
Step-by-Step: Activating Bar Replay
The activation process takes under a minute once you know where to look.
Step 1: Open your chart. Go to TradingView and open the asset you want to practise on. Bar Replay works across all markets — crypto, stocks, forex, commodities — and across all timeframes. Select the asset and timeframe you actually trade, not just the most convenient one.
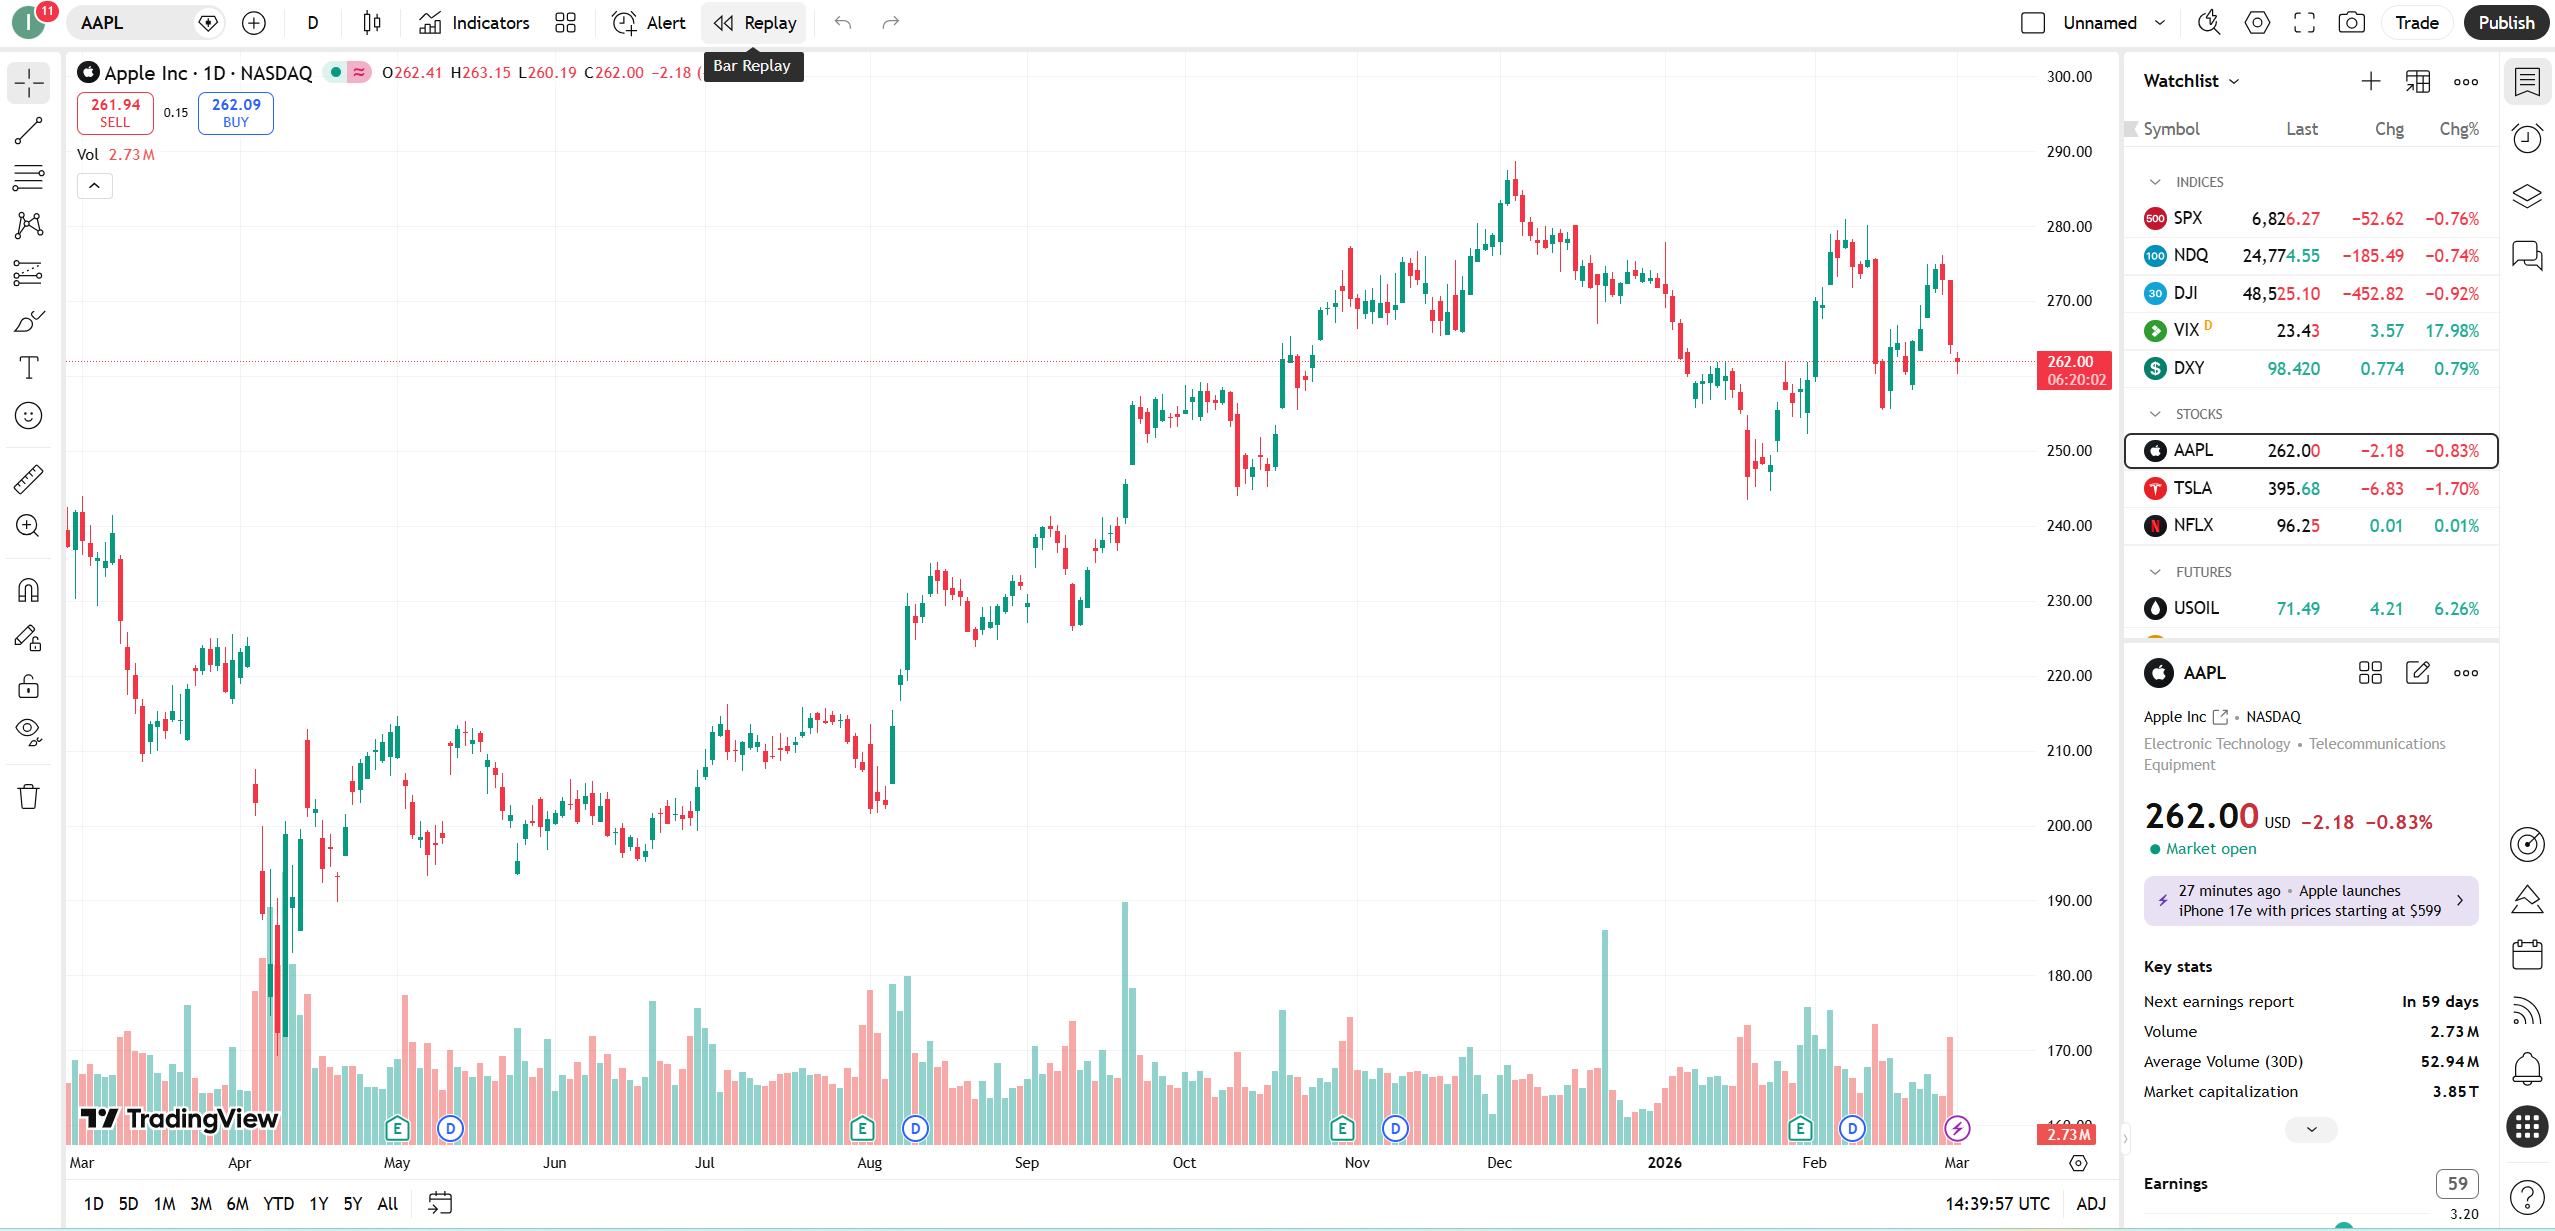
Step 2: Locate the Bar Replay button. Look at the top toolbar of your chart. The Bar Replay icon appears as a play button symbol in the toolbar row. Click this icon to enter replay mode.

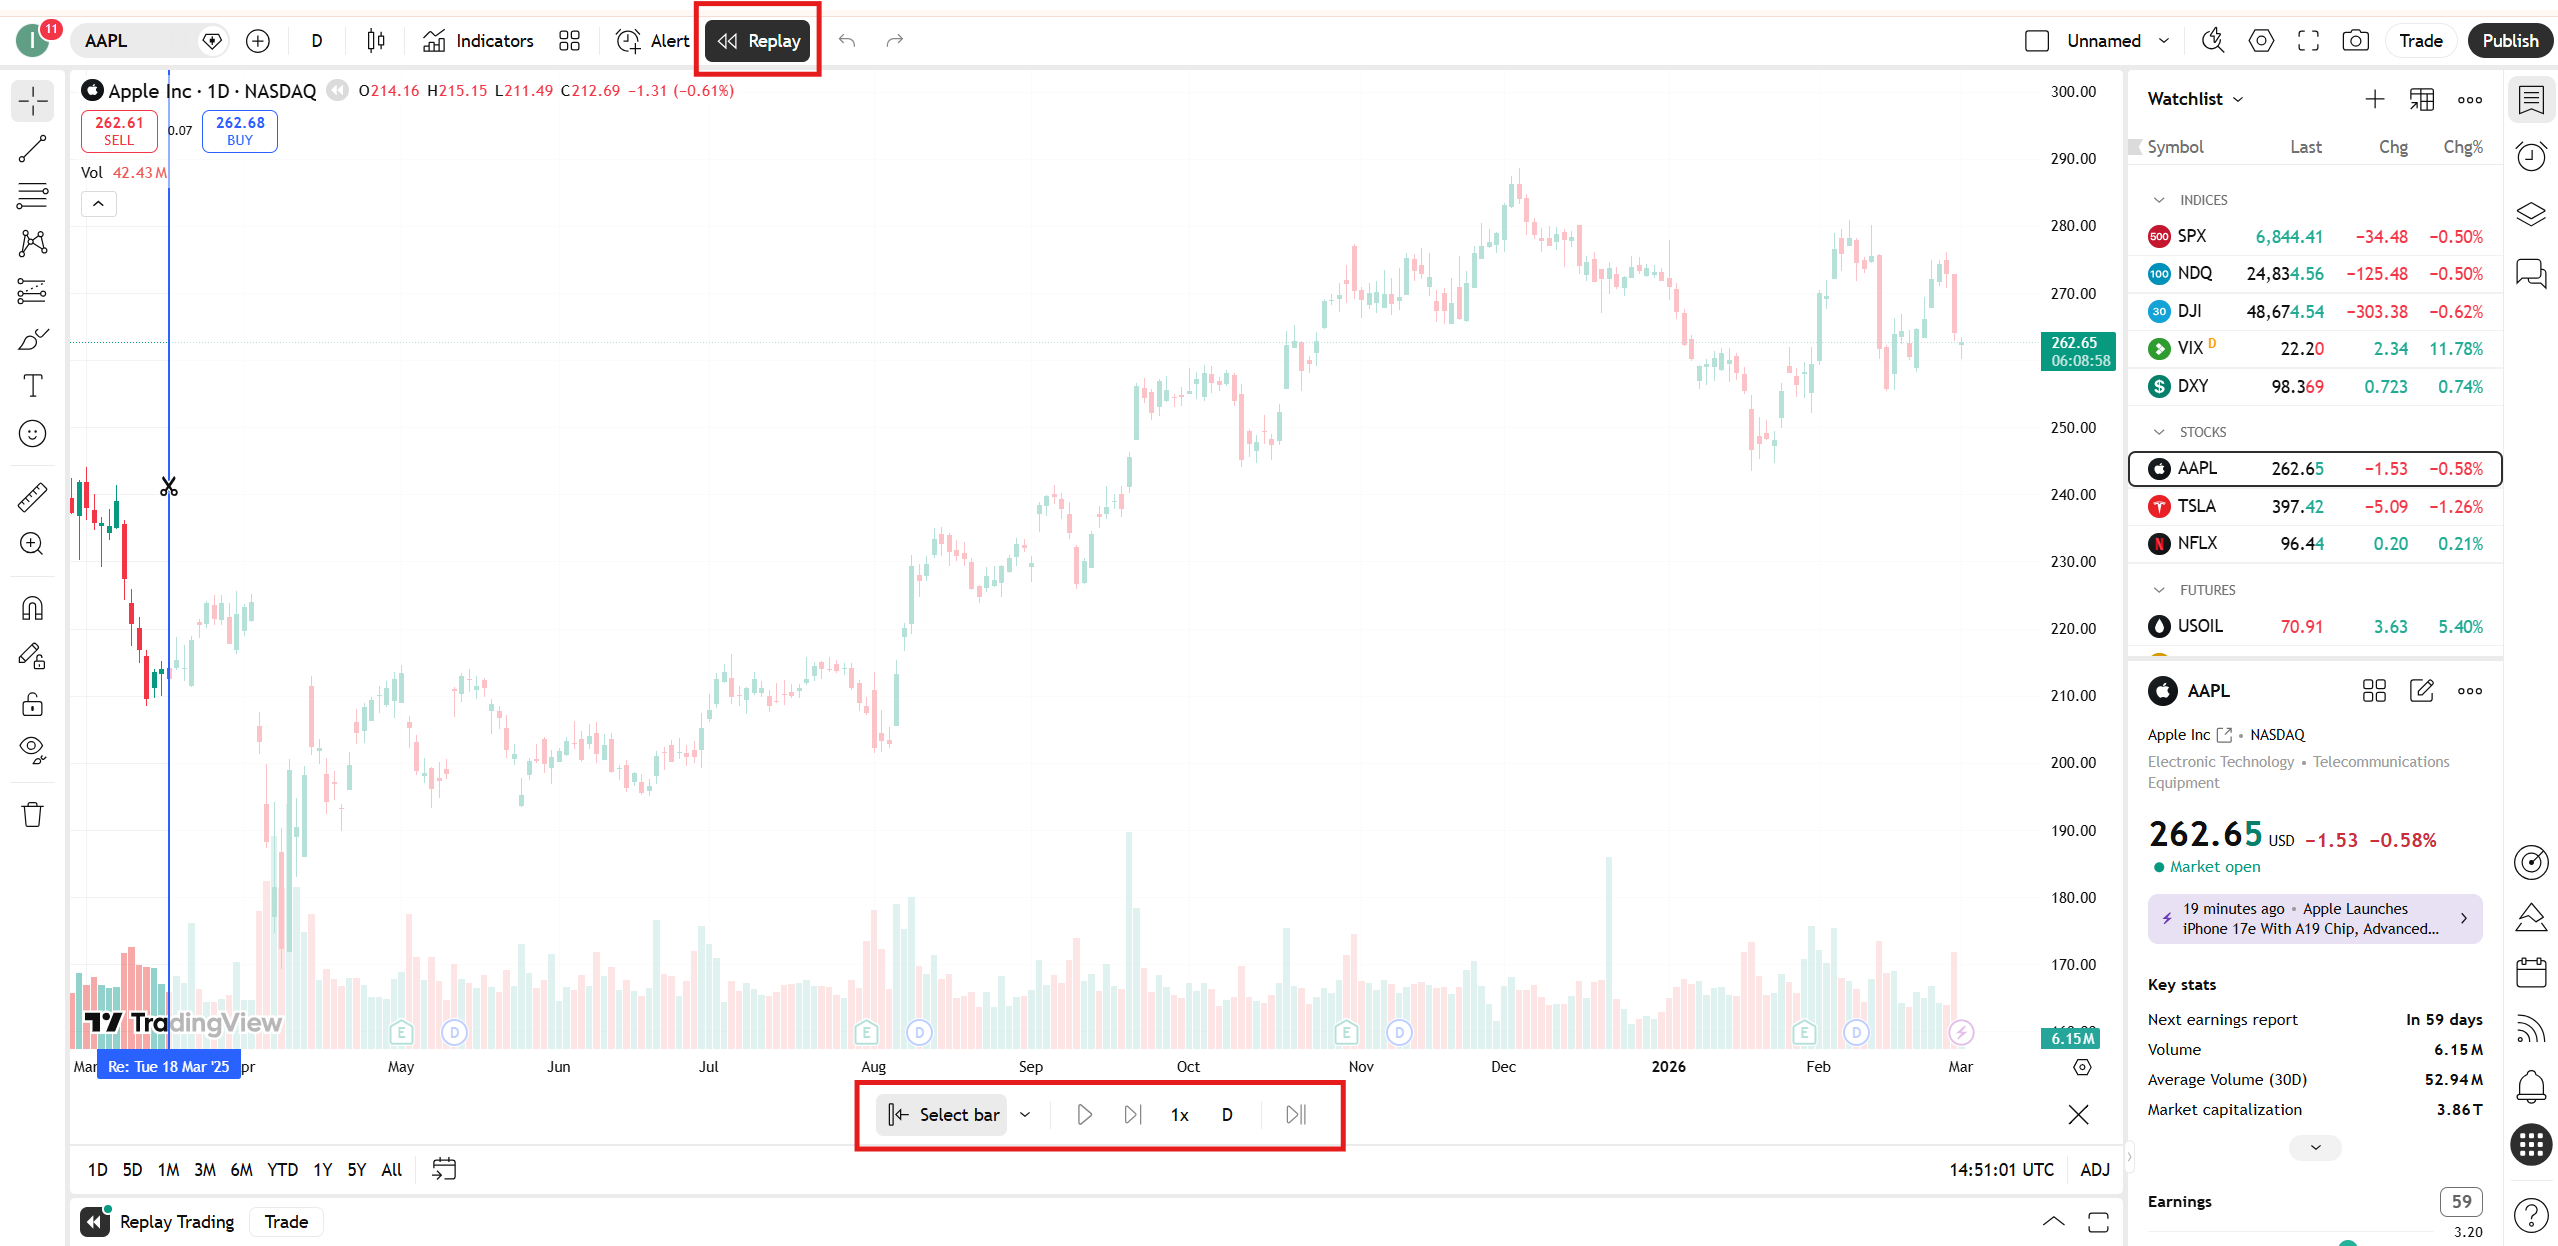
Step 3: Select your starting point. Once Bar Replay is activated, a vertical blue selector line appears on your chart. Drag the vertical line to the historical candle where you want your practice session to begin. Choose a point with enough preceding price action to provide context — at least 30-50 candles before a known setup type. All candles after your selected point will be hidden when you click Play.
Step 4: Use the playback controls. The replay control bar appears at the bottom of the chart once replay begins. You can play continuously at adjustable speeds, pause at any moment, or advance exactly one candle at a time using the step-forward button. For skill development, one-candle-at-a-time advancement is the most valuable mode — it forces an explicit decision at each candle rather than allowing passive observation.
Using Bar Replay for Pattern Recognition Training
Genuine pattern recognition improvement requires a structured approach rather than passive chart watching.
Before starting each replay session, define what you are looking for — a specific setup type such as a breakout above resistance with RSI confirmation, a pullback to a moving average with a bullish candle structure, or a trend continuation pattern following a consolidation. Practising with a defined target setup prevents the common mistake of watching price unfold and concluding retrospectively that you would have taken the trade — which is hindsight bias in a slightly more subtle form.
As you step through candles, pause whenever your setup conditions are approaching. Ask explicitly: do the conditions for entry exist right now, based only on what is visible? If yes, write down your entry price, stop-loss level, and take-profit target before advancing the next candle. This pre-commitment to decisions is what builds genuine pattern recognition — the habit of identifying conditions before knowing the outcome.
For specific indicator configurations that work well with Bar Replay practice sessions, our best TradingView indicators for crypto trading guide covers RSI, EMA, and MACD setups with practical settings recommendations.
Combining Bar Replay With Multi-Timeframe Analysis
This is where the feature becomes most powerful for intermediate and advanced traders.
Multi-timeframe analysis — checking the daily chart for trend context before acting on a 1H signal — is one of the most reliable improvements any trader can make. Multi-timeframe Bar Replay is most useful when your plan supports multiple charts per layout. TradingView supports synchronised Bar Replay across all charts in a layout, allowing you to study the same market across different timeframes as price unfolds — check current TradingView plan limits before upgrading specifically for this workflow.
This is significantly more valuable than single-timeframe replay because it trains the top-down analysis habit that separates structured traders from reactive ones. To set this up: configure your multi-chart layout first, then activate Bar Replay on your primary chart — the replay synchronises across charts automatically. For the complete multi-chart layout setup process, our multi-chart TradingView guide covers the configuration in detail.
Combining Bar Replay With Paper Trading
Bar Replay can be combined with a structured paper-trading-style practice workflow, but the exact order-entry options available during replay may depend on your TradingView setup, account type, and current platform functionality.
You can use Bar Replay alongside a structured practice log: mark hypothetical entries, stops, and exits as price unfolds, then record the result after the replay completes. Where your TradingView setup allows simulated order entry during replay, Paper Trading can make the practice more realistic — setting stop-loss and take-profit on every hypothetical trade, exactly as you would live.
This combination is as close as retail traders can get to live trading practice without actual capital at risk. One 45-minute session per week on 30-40 historical candles with paper trades placed and documented builds execution skills faster than any amount of passive chart review. For the complete paper trading setup guide, our TradingView paper trading guide covers the full workflow.
Building a Structured Practice Session
Random replay produces random results. Here is how to structure each session for maximum training value.
Pre-session setup. Before activating replay, add your standard indicators to the chart — the same configuration you use in live trading. Practising with your actual indicator setup rather than a simplified version ensures the practice transfers to your real trading environment.
Define the session goal. Each replay session should have a specific focus — “today I am practising breakout entries on the 4H chart with RSI confirmation.” This prevents unfocused scrolling through price action. Pick one setup type per session and replay exclusively for that setup.
Step through candles deliberately. Use the step-forward button rather than continuous play for the sections approaching potential setups. Slow down where decisions need to be made. Speed up through clear non-setup periods.
Document every decision. Keep a simple session log — candle timestamp, setup conditions present, entry decision (yes/no), entry price, stop level, target. This converts practice into measurable data. Over 20-30 sessions you will identify patterns: which conditions you consistently misread, which setups you tend to enter too early, and which market environments your strategy handles poorly.
Review after each session. After completing the replay, advance through the hidden candles at full speed to see what actually happened. Compare your logged decisions against the actual price action. This is the feedback loop that converts practice into genuine skill improvement.
What Bar Replay Cannot Do
Bar Replay is a training tool, not proof that a trading strategy will be profitable. It cannot remove emotional pressure from real trading, guarantee future results, or fully replicate live market conditions such as slippage, spreads, liquidity, and execution delays. Use it to improve decision quality and pattern recognition, but validate any trading approach with proper risk management before using real capital.
Common Mistakes That Waste Bar Replay Time
These patterns prevent traders from getting genuine training value from Bar Replay.
Watching passively instead of deciding actively. Clicking Play and watching price unfold without making explicit entry decisions at each pause point trains observation, not execution. Force explicit decisions — even if you decide not to trade, that decision should be conscious and reasoned.
Only replaying setups you already know worked. Choosing historical periods where you know a big move occurred trains pattern recognition only for the most obvious setups in hindsight. Include failed setups, false breakouts, and choppy periods. These are the conditions that produce losses in live trading, and they are exactly what needs to be trained.
Fast-forwarding through difficult sections. The periods where price action is unclear are the most valuable for training. Slowing down in the difficult sections, not speeding through them, is where real skill is built.
Practising without indicators. Always replay with the same chart configuration you trade with live. Practising without your actual indicator setup creates a practice environment that does not match your live trading environment.
Free vs Paid Plan: What Bar Replay Differences Matter
TradingView supports Bar Replay, but the amount of historical data available depends on the symbol, chart interval, and plan. Daily and higher-timeframe charts generally provide more historical replay depth, while intraday replay depth can vary more significantly by subscription level.
Paid plans can add meaningful capability for advanced replay practice — more chart layouts, more indicators per chart, and deeper intraday historical data. TradingView’s own documentation notes that Bar Replay historical depth varies by plan on intraday intervals, so check current plan limits before upgrading specifically for replay practice.
For most developing traders, the best starting point is to test Bar Replay on the market and timeframe you actually trade, then upgrade only if the historical depth, indicator limit, or single-chart limitation becomes a genuine constraint. Explore TradingView’s plan options here.
What To Do Next
Do this today — the first structured session takes 45 minutes:
Open Bitcoin on the 4H chart. Add your standard indicators. Activate Bar Replay from the toolbar. Set your starting point to 60 candles before the most recent significant price move. Step through candle by candle with one specific setup in mind. Make one explicit entry decision per session — even if that decision is “no trade, conditions not met.” Document it. Review the outcome against actual price action after the session ends.
After ten structured sessions with this approach, you should have a clearer record of how consistently you recognise the replayed setup type, where your entries are early or late, and which market conditions create the most mistakes. The training value is in that record — not in passive chart watching.
For the complete TradingView workflow surrounding Bar Replay — alert configuration, indicator setup, and multi-chart layouts — our TradingView review covers everything the platform offers. For building alerts to monitor live markets between practice sessions, our TradingView alerts guide covers the complete alert setup workflow.
Explore TradingView’s plan options here.
Related TradingView Guides
- TradingView Review: Is It the Best Charting Platform for Crypto?
- TradingView Alerts Explained: Complete Setup Guide
- How to Use TradingView Paper Trading
- How to Use Multiple Charts in TradingView
- Best TradingView Indicators for Crypto Trading
- TradingView Free vs Paid: Which Plan Do You Actually Need?
Frequently Asked Questions
Is TradingView Bar Replay available on the free plan?
TradingView provides Bar Replay access, but the exact historical depth and available replay functionality can vary by symbol, timeframe, and plan. The main practical limitation for free users is usually historical depth and chart-layout flexibility. If you need multi-timeframe simultaneous replay, more indicators, or deeper intraday history, check TradingView’s current plan limits before upgrading.
Can I use Bar Replay with indicators active?
Yes — and you should. Add your EMAs, RSI, MACD, or whatever indicators you use in live trading before activating replay. The indicators recalculate in real time as each new candle is revealed, exactly as they would in live trading — giving you accurate indicator readings at each decision point without future data contamination.
How far back can I replay historical data?
The historical data depth available for Bar Replay depends on your plan and the specific asset. On the free plan, historical data is available but depth is limited. Paid plans provide deeper historical access. For major assets like Bitcoin, EURUSD, or large-cap stocks, sufficient historical data for meaningful practice sessions is available on all plans.
How is Bar Replay different from the Strategy Tester?
Bar Replay is a manual, visual practice tool — you make each decision yourself as price unfolds. The Strategy Tester is an automated backtesting tool that runs a coded Pine Script strategy against historical data and produces statistical performance metrics without any manual decision-making. Bar Replay is best for discretionary traders improving real-time pattern recognition. The Strategy Tester is best for algorithmic traders validating coded strategy logic at scale. For discretionary traders, combining manual replay practice with rule-based backtesting gives the most complete picture of strategy viability — see Tradeciety’s backtesting guide for a practical framework on this approach.
Can I place trades during Bar Replay?
You cannot place live trades during Bar Replay — the feature is a historical replay tool, not a live trading interface. TradingView also supports a separate historical Replay Trading mode inside Bar Replay, where trade data is available only during that replay session and is not saved afterward. If you prefer a simpler workflow, you can also log hypothetical entries, stops, exits, and results manually as you step through historical candles. Our TradingView paper trading guide covers the broader simulated trading setup.
