TradingView Screener: How to Find Better Trades Faster (2026)
Affiliate Disclosure: This article contains affiliate links. If you sign up for TradingView through our link, we may earn a commission at no extra cost to you. We only recommend platforms we genuinely believe in.
The tradingview screener solves a problem every active trader faces: there are thousands of instruments to watch and not enough time to check them all manually. Whether you trade stocks, crypto, forex, or ETFs, scanning the market by hand is slow, inconsistent, and easy to get wrong. The tradingview screener replaces that process with a filtered, data-driven approach that surfaces the exact setups you are looking for — in seconds.
TradingView’s screener is one of the most capable built-in tools on the platform, and most traders use only a fraction of what it can do. This guide covers the full workflow — from opening the tradingview screener for the first time to building a saved crypto scan with multiple technical conditions — written specifically for traders who want actionable results, not a features list.
Quick Answer
The tradingview screener lets you filter stocks, crypto, forex, and ETFs by technical indicators, fundamental metrics, and price data simultaneously. Access it via Products → Screeners from any TradingView page. Set your filters, sort the results, and click any instrument to open it directly on a chart. The basic screener is available on all plans including Free. Advanced filter depth and saved screens require a paid plan.
What the TradingView Screener Actually Does
The tradingview screener is a filtering tool. You give it a set of conditions — RSI below 30, market cap above $2 billion, volume above its 20-day average — and it returns every instrument that currently meets all of them. Instead of opening fifty charts hoping to find an oversold large-cap with rising volume, you define the criteria once and the screener does the work.
What makes TradingView’s implementation particularly strong is the combination of technical and fundamental filters in the same tool. Most dedicated stock screeners handle fundamentals well but have limited technical indicator support. Most charting platforms handle technical analysis well but have weak screening tools. TradingView combines both — you can screen for stocks where RSI is below 40, P/E ratio is under 15, and the 50-day moving average is above the 200-day moving average, all in a single filter set.
TradingView currently offers five screener types: Stocks, ETFs, Bonds, Crypto, and Pine. Each is tailored to its asset class with relevant filter categories. The Pine Screener is a more advanced variant that lets you scan watchlists using custom Pine Script indicators — more on that later in this guide. TradingView’s official screeners walkthrough covers all five types in detail if you want the full technical reference alongside this practical guide.
How to Open the TradingView Screener
There are two ways to access the tradingview screener. From any TradingView page, click the Products dropdown in the top navigation bar, hover over Screeners, and select the asset type you want — Stocks, ETFs, Bonds, Crypto, or Pine. The second method is from within Supercharts — look for the Screener tab in the right toolbar. Both routes take you to the same tool with identical functionality.
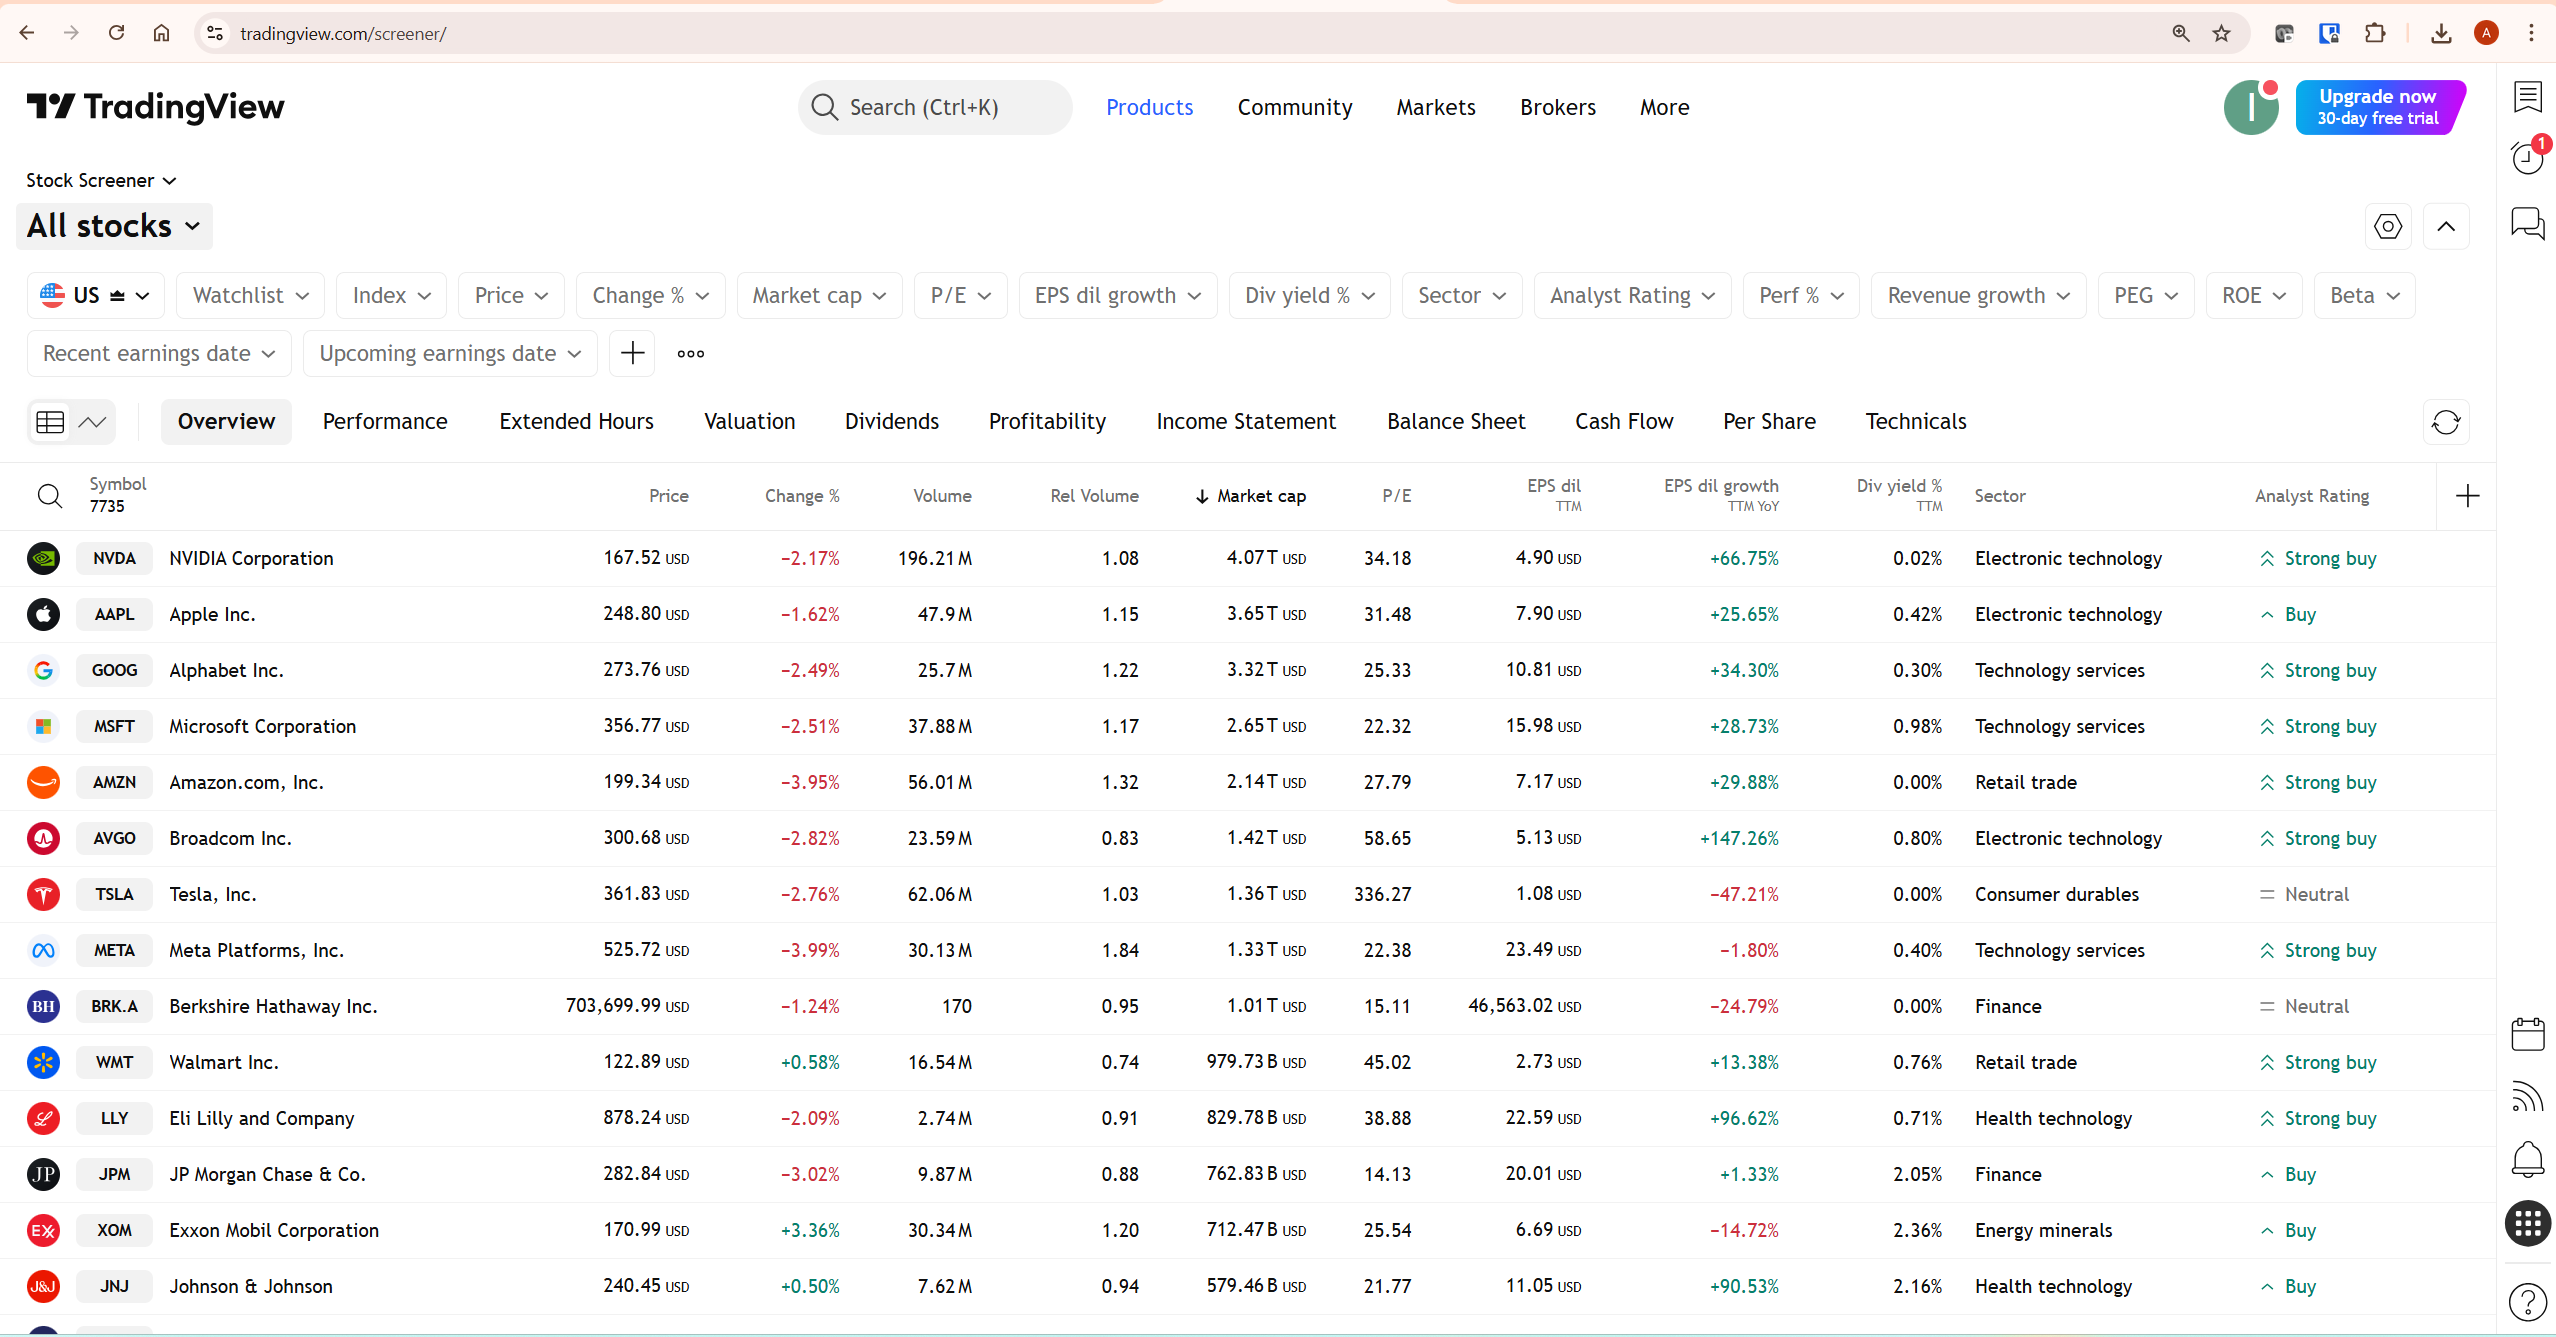
When the screener opens, you will see the default view for your region — typically US stocks sorted by market capitalisation. At the top you have a row of filter dropdowns. Below that is a data table showing every instrument that currently passes the active filters. Each row represents one instrument, with columns showing the metrics you have chosen to display.
The tradingview screener updated its layout in May 2025, moving from a panel below the chart to a dedicated standalone page. If you have used the old in-chart screener and found it limited, the current version is substantially more capable — it handles more filters simultaneously and the results table is far more customisable.
Understanding the TradingView Screener Filter System
The filter bar runs across the top of the tradingview screener. Each button represents a filter category. Clicking any filter opens a dropdown where you set your conditions. The screener updates the results table in real time as you add or adjust filters — you do not need to click a search button.
Filters are organised into three broad categories. Market data filters cover price, volume, change percentage, market capitalisation, beta, and similar trading metrics. Fundamental filters cover valuation ratios like P/E, P/B, earnings per share, dividend yield, revenue growth, and balance sheet metrics. Technical filters cover indicator readings — RSI, MACD, moving averages, Stochastic RSI, Momentum, EMA, SMA, Keltner Channels, and many others.
To add a filter, click the + button in the filter bar or press Shift + F. A search box appears where you can type the metric name directly. This is faster than browsing categories when you know exactly what you want. You can stack as many filters as you need — the tradingview screener applies them all simultaneously using AND logic, meaning every result meets every active condition.
How to Use the TradingView Screener for Crypto
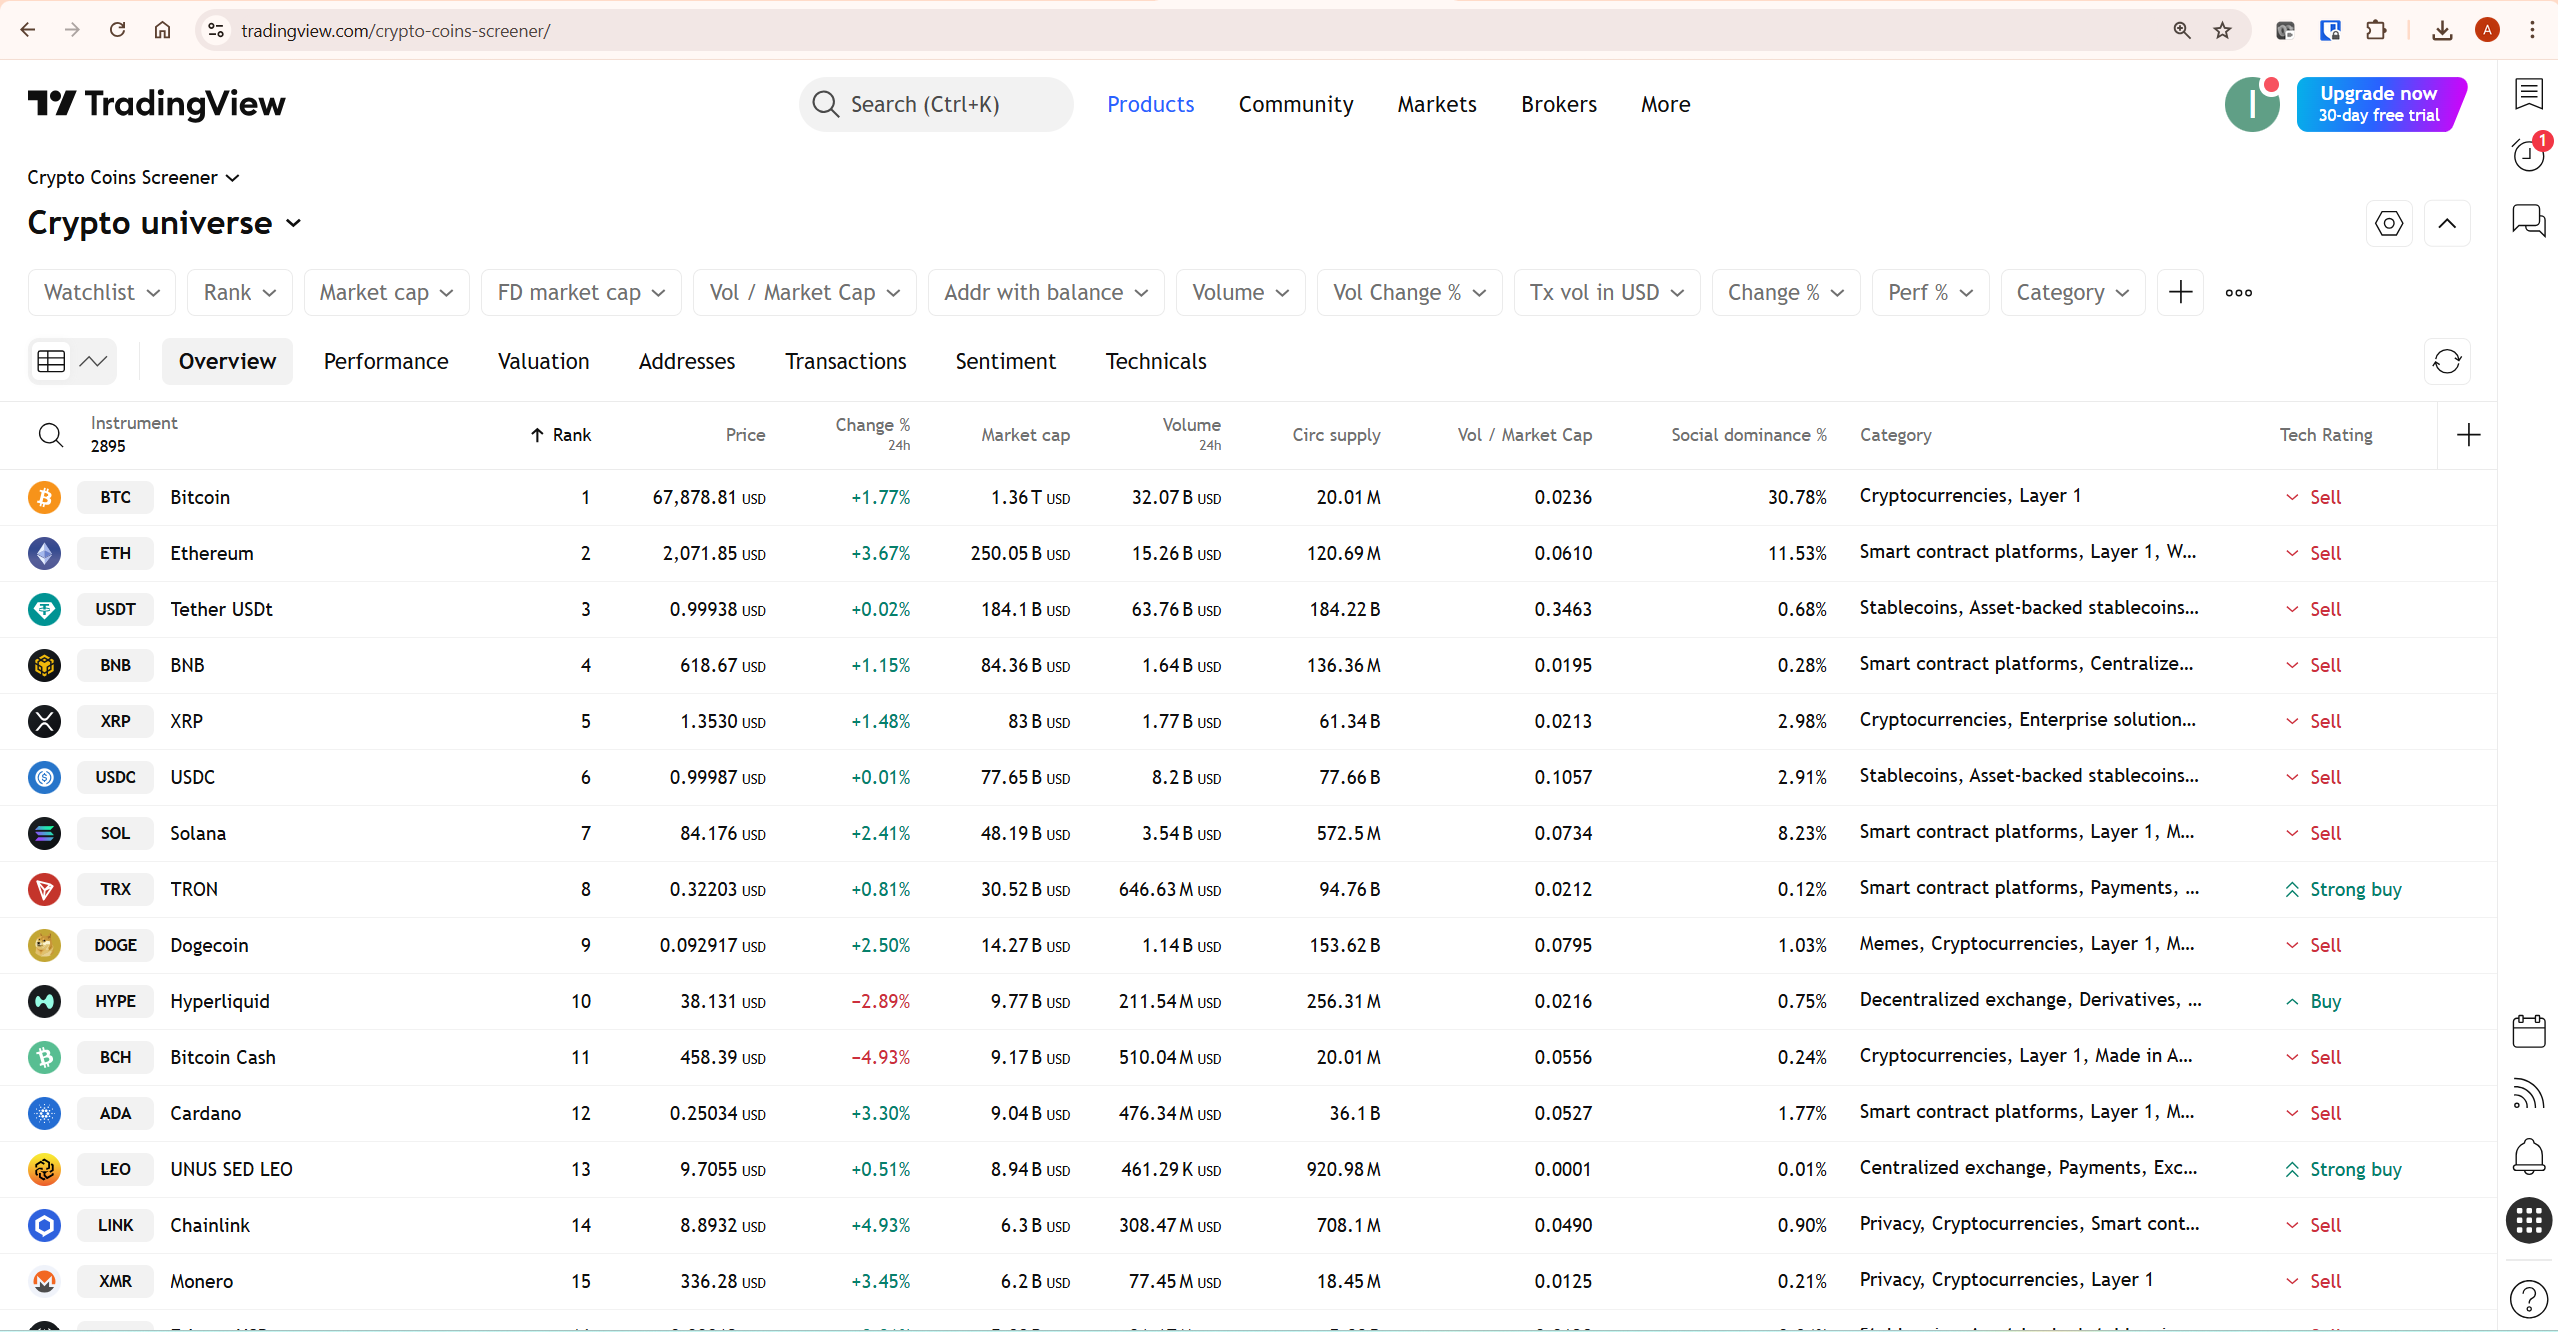
The tradingview screener for crypto works identically to the Stock screener but is built around crypto-specific metrics. Switch to it by clicking the asset type dropdown in the top left — it defaults to Stock Screener but the dropdown shows all available screener types. Select Crypto Coins Screener and the table immediately repopulates with cryptocurrency data.
The crypto screener displays over 2,800 instruments by default, sorted by rank. Columns include price, 24-hour change, market cap, volume, circulating supply, volume-to-market-cap ratio, social dominance percentage, category, and technical rating. The category column is particularly useful — it lets you filter by blockchain layer (Layer 1, Layer 2), protocol type (DeFi, stablecoins, smart contract platforms), or specific ecosystem.
For crypto traders, the most practical filter combinations involve technical conditions alongside volume metrics. A setup scan for oversold large-cap crypto might filter for: market cap above $1 billion, 24-hour change between -5% and -15% (a pullback rather than a collapse), RSI below 35, and volume above its 20-day average. That combination identifies assets that have pulled back meaningfully on elevated volume — a classic setup condition for traders looking for bounce entries.
Building a Practical Stock Screen Step by Step
The best way to understand the tradingview screener is to build a real scan. Here is a complete workflow for a momentum scan — identifying stocks with strong recent price action and rising volume, which is one of the most commonly used setups among active traders.
Step 1 — Open the Stock Screener via Products → Screeners → Stocks. You will see the default US market view.
Step 2 — Set the market. By default the screener shows all US stocks. If you want a specific exchange — NYSE only, NASDAQ only — click the market selector at the top left and filter by exchange. For a broad momentum scan, all US stocks is fine.
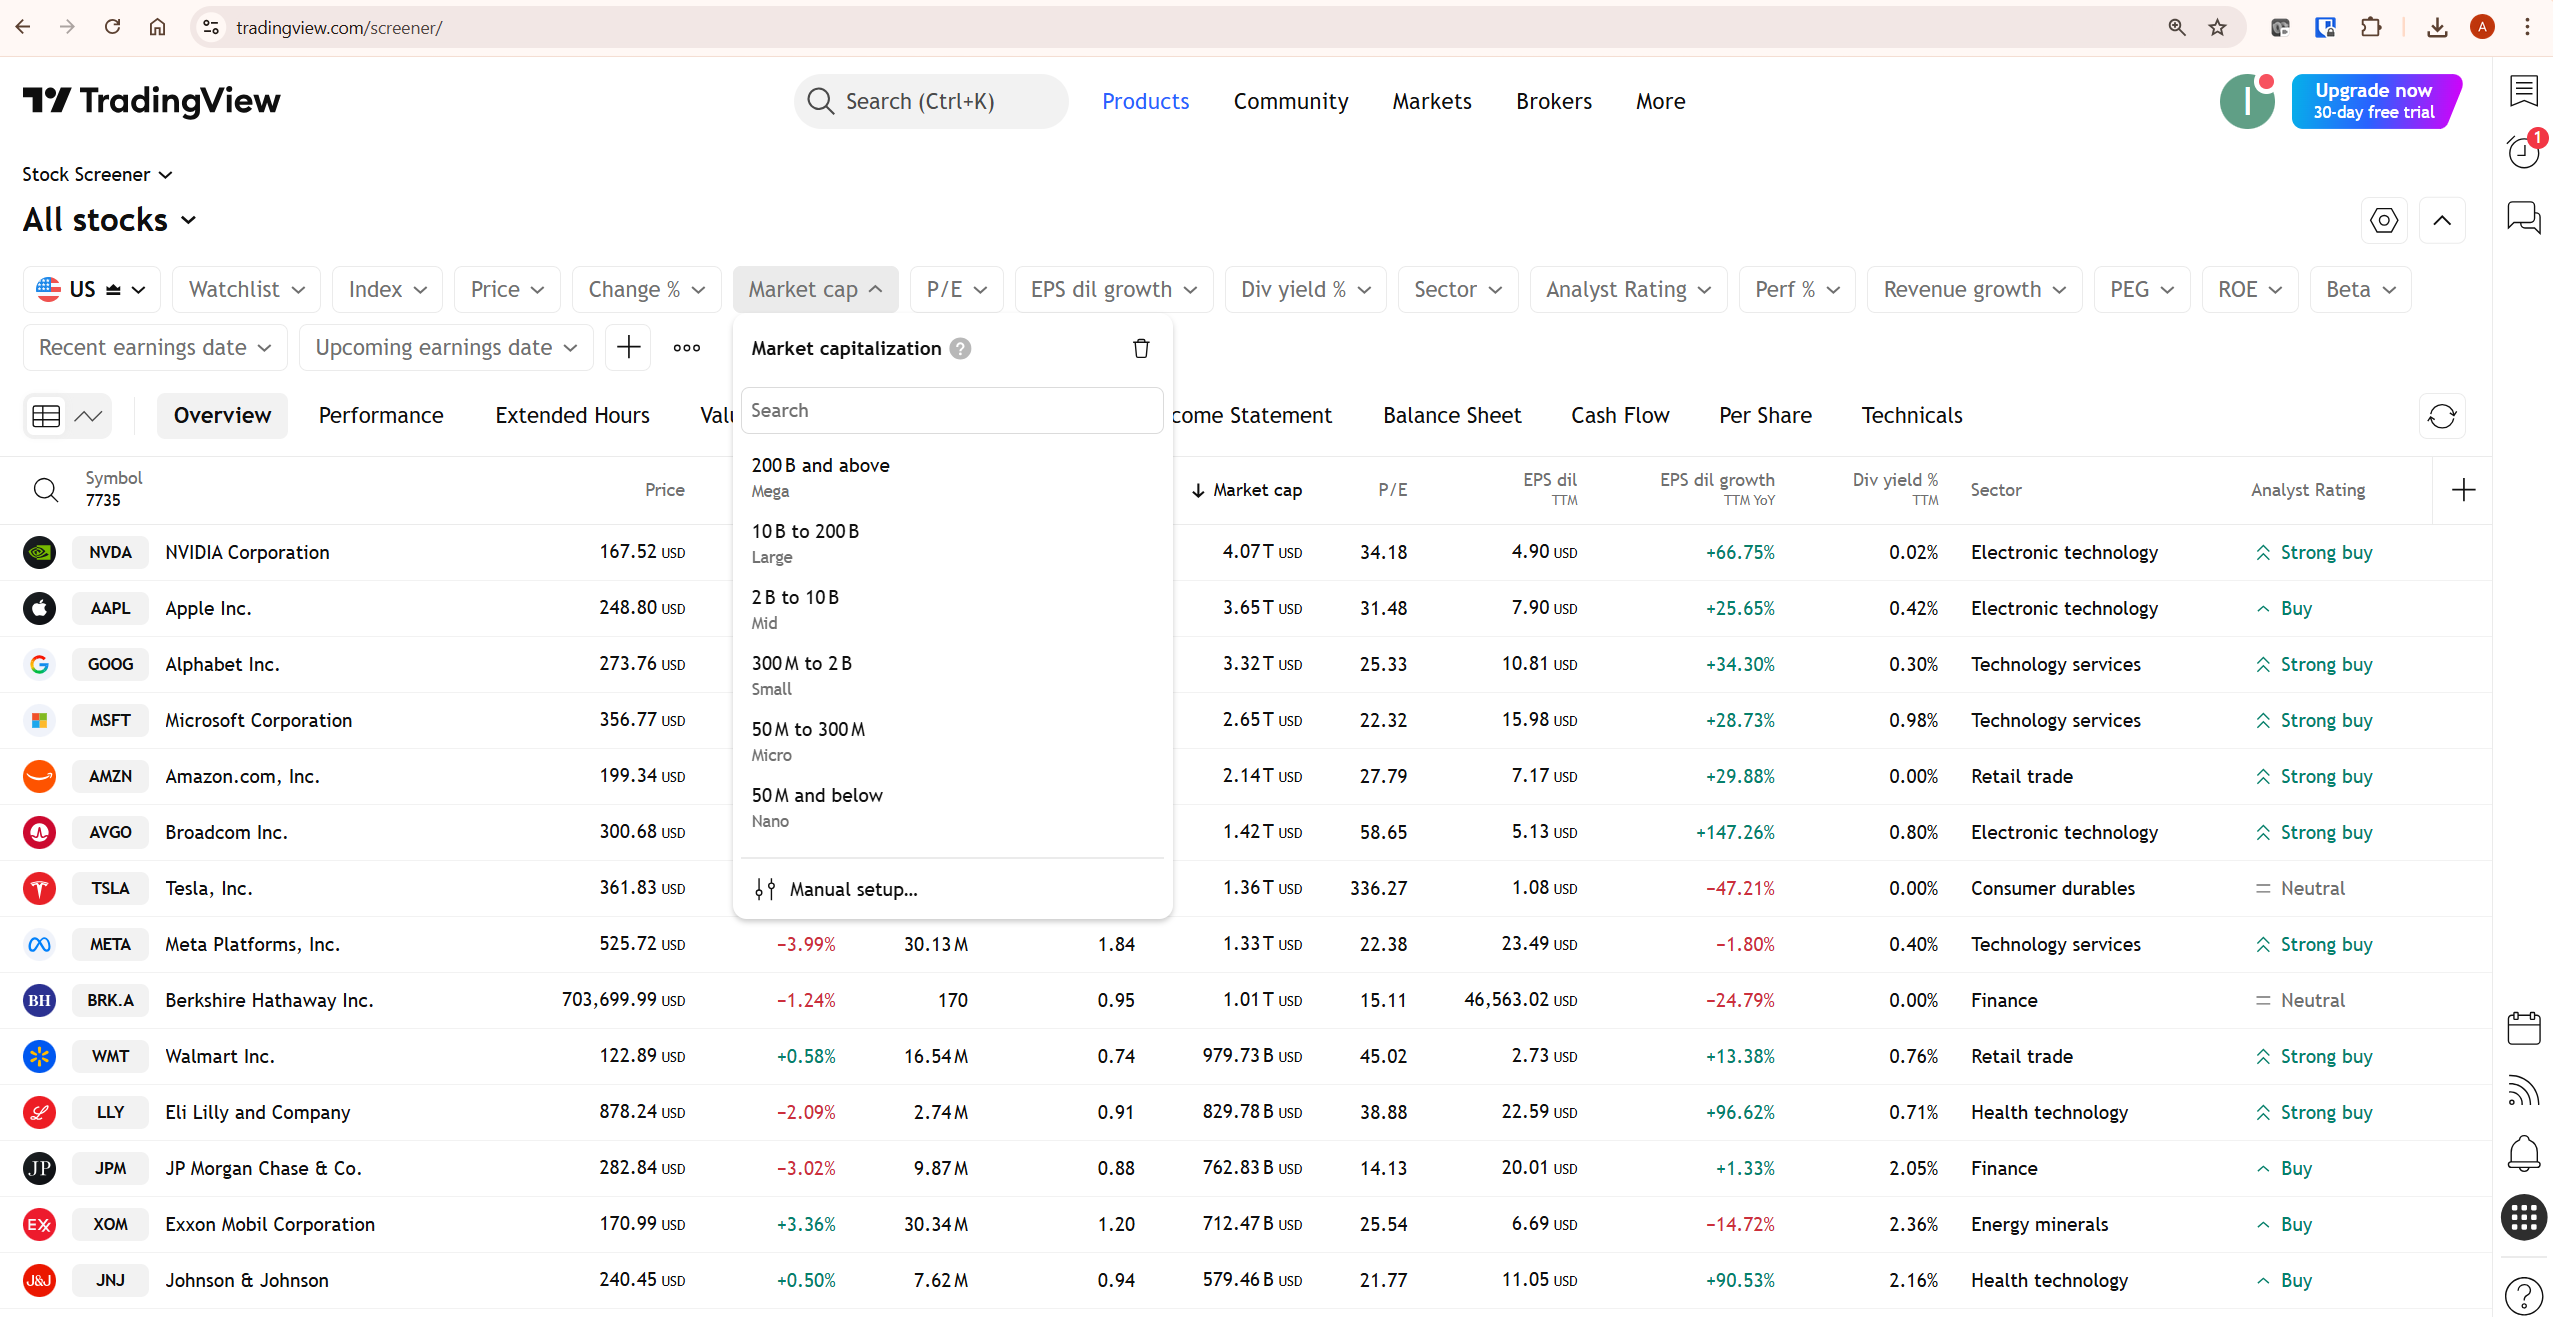
Step 3 — Add a market cap filter. Click Market Cap in the filter bar and select Large (2B to 10B) or Mega (200B and above). This removes penny stocks and illiquid micro-caps from the results, which tend to produce unreliable signals.
Step 4 — Add a volume filter. Click the + button, search for “Relative Volume” and set it above 1.5. This means the stock’s current volume is at least 50% above its average — a reliable signal that something meaningful is happening.
Step 5 — Add a price performance filter. Search for “Performance” and set the 1-week performance above 3%. This confirms the stock is already moving in the right direction rather than just having elevated volume on a flat day.
Step 6 — Add an RSI filter. Search for RSI and set it between 55 and 75. This confirms bullish momentum without the stock being overbought. RSI above 75 often signals a setup that is already exhausted.
Step 7 — Sort by relative volume. Click the Relative Volume column header to sort results from highest to lowest. The stocks at the top of the list are the ones with the most unusual activity relative to their own history — these are the highest-priority candidates to review first.
Step 8 — Save the screen. Click the screen name at the top left and select Save Screen. Name it clearly — “US Large Cap Momentum” for example. Saved screens reopen instantly with all your filters intact. On paid plans, you can save unlimited screens. The free plan allows a limited number of saves.
Customising the Results Table
The default column layout shows an overview — price, change percentage, volume, market cap, P/E ratio, and analyst rating. You can change this completely by switching between the preset column sets at the top of the table. TradingView provides presets for Performance, Extended Hours, Valuation, Dividends, Profitability, Income Statement, Balance Sheet, Cash Flow, Per Share, and Technicals. Each preset swaps the visible columns to match the analysis type.
For technical traders, the Technicals preset is the most useful — it shows RSI, MACD, moving average signals, and technical rating for each stock at a glance. For value investors running fundamental screens, the Valuation or Profitability preset gives you the ratio data you need without switching to individual charts.
You can also add custom columns by clicking the + button on the right side of the column header row. This opens the same metric search used for filters — type any data point and add it as a column. If you want to see a specific moving average period that is not in the default view, you can add it here and configure the interval separately.
Clicking any row in the results table opens that instrument’s chart directly — the tradingview screener and the charting environment are fully integrated. You do not need to copy a ticker symbol and search for it separately. This is one of the genuine workflow advantages of using TradingView’s built-in screener rather than an external scanning tool.
The Pine Screener: Advanced Scanning with Custom Indicators
The Pine Screener is a separate tool within the screener family that lets you scan watchlists using custom Pine Script indicators rather than preset filter conditions. Instead of filtering by standard metrics, you apply any indicator from your favourites list and the Pine Screener runs it across every symbol in your selected watchlist simultaneously.
Access it via Products → Screeners → Pine. The workflow is different from the standard tradingview screener. You first select a watchlist as your universe of symbols, then choose an indicator from your favourites. The Pine Screener runs that indicator across every symbol and displays the results in a comparative table — letting you identify which symbols currently show the strongest signal according to your indicator’s logic.
This is particularly powerful for traders who use custom Pine Script indicators. If you have built a proprietary momentum indicator or a volatility squeeze detection script, the Pine Screener lets you run it across hundreds of symbols in seconds rather than checking each chart manually. It is a significant time-saver for systematic traders with an established indicator-based methodology.
One important note: indicators must be in your TradingView favourites list to appear in the Pine Screener’s indicator dropdown. If you cannot find an indicator there, go back to Supercharts, add it to your favourites, and return to the Pine Screener. Full requirements are covered in TradingView’s official Pine Screener documentation.
For traders who want to build their own Pine Script indicators to use with the Pine Screener, our Pine Script tutorial for beginners covers the full v6 workflow from scratch.
Common Mistakes Traders Make with the TradingView Screener
The most common mistake is stacking too many filters and getting zero results. When your tradingview screener returns nothing, it does not mean no opportunities exist — it means your conditions are too restrictive for the current market environment. Remove one filter at a time, starting with the most specific condition, until results appear. This also teaches you which filters are doing the most work in your scan.
The second mistake is treating screener results as trade signals. A stock appearing in your momentum screen is a candidate for further analysis, not an automatic entry. The screener identifies where to look — the chart analysis determines whether to act. Running a tradingview screener without following up with chart review on the results is like using a filter to find candidates for an interview and then hiring without the interview.
The third mistake is ignoring the time sensitivity of filter results. Technical conditions like RSI readings change with every bar. A stock showing RSI below 30 on the screener might show RSI at 35 by the time you open its chart, depending on intraday price movement. Screener results are a snapshot of current conditions — treat them as the starting point of your analysis session, not a list to work through mechanically over several hours.
The fourth mistake is not saving screens. Building a quality scan setup takes time. Traders who do not save their screens rebuild them from scratch every session, which leads to inconsistency. Save every screen you plan to use regularly and name them clearly so you can find them immediately when markets open.
TradingView Screener: Free vs Paid Plan Differences
The basic tradingview screener is available on all plans including Free. Free users can apply filters, view results, and open charts from screener results without restriction. The meaningful limitations on the free tier relate to how many screens you can save and the data depth available for certain technical filters.
Paid plans unlock additional filter options, deeper historical data for indicator-based filters, and the ability to save more screens. The Pine Screener requires a paid plan to access. For traders who rely heavily on custom indicator scanning, that restriction makes Essential the minimum viable starting point.
For a complete breakdown of what each plan unlocks across the entire TradingView platform, our TradingView free vs paid guide covers every tier in detail. If you are not yet on a paid plan and want to unlock the full screener functionality, start a 30-day free trial at TradingView — no commitment required, and it gives you access to every paid feature for a full month to evaluate whether the upgrade makes sense for your workflow.
What to Do Next
Open TradingView right now and build your first saved screen using the tradingview screener. Start with three filters maximum — one market cap or volume filter to define your universe, one technical condition, and one price performance condition. Run the scan, look at the top five results on their charts, and see whether the screener is surfacing setups that match your trading approach.
If it is, save the screen and use it at the start of every trading session. If it is not, adjust one filter at a time until the results match what you are actually looking for. That iterative process of refining your screen is how experienced traders develop their scanning workflow over time — not by starting with a perfect filter set, but by improving it progressively based on what the results show.
Frequently Asked Questions
Is the TradingView screener free to use?
Yes — the basic tradingview screener is available on all plans including Free. You can set filters, view results, and open charts from screener results without a paid subscription. The Pine Screener and some advanced filter options require a paid plan. Saving multiple custom screens also has limitations on the free tier.
Can I screen for crypto on TradingView?
Yes. The tradingview screener includes a dedicated Crypto Coins Screener covering over 2,800 instruments. It includes crypto-specific filters such as market cap rank, circulating supply, volume-to-market-cap ratio, social dominance, and category. Technical indicator filters work identically to the stock screener. Access it via Products → Screeners → Crypto Coins.
Can I use my own Pine Script indicators in the TradingView screener?
Yes, through the Pine Screener. This separate tool lets you scan any watchlist using custom Pine Script indicators from your favourites. It is available on paid plans. The standard Stock and Crypto screeners use preset filter conditions only — Pine Script integration is exclusive to the Pine Screener product.
How often does the TradingView screener update?
The tradingview screener updates in real time during market hours. You can also configure the refresh interval in the screener settings — options include manual refresh, every minute, every five minutes, and other intervals. For intraday scanning, real-time refresh is recommended. For end-of-day swing trading scans, a longer refresh interval reduces noise.
What is the difference between the TradingView screener and alerts?
The tradingview screener shows you which instruments currently meet your conditions when you actively open it. Alerts notify you when a specific condition is met on a specific instrument, even when you are not watching the screen. For active monitoring during a trading session, the screener is the right tool. For passive monitoring across a watchlist, alerts are more effective. Used together, they cover both use cases. Our TradingView alerts guide explains how to set up alerts that complement your screener workflow.
Can I save screener results as a watchlist?
Not directly with a single button — but you can manually add instruments from screener results to any existing watchlist by clicking on the instrument and using the watchlist option from the chart. For traders who run regular scans and want to track results over time, building a dedicated watchlist from screener output is a practical workflow that many active traders use.
Conclusion
The tradingview screener is one of the most practical tools on the platform — and one of the most underused. Traders who rely on manually browsing charts are working harder than they need to. A well-configured screen that matches your trading methodology surfaces better candidates in less time and removes the bias that comes from only watching instruments you already know about.
Start with a simple three-filter screen, save it, and use it consistently. For crypto traders, the Crypto Coins Screener combined with technical filters is a genuinely powerful market scanning tool that requires no external software. For systematic traders, the Pine Screener takes that capability further by letting you run your own custom indicators across entire watchlists simultaneously.
For a full review of everything TradingView offers beyond the screener, our TradingView review covers the complete platform. To understand how the screener integrates with TradingView’s charting environment, our guide to using TradingView for crypto trading shows the full analytical workflow in practice. Ready to put the screener to work? Start your free trial at TradingView and build your first screen today.