
TradingView VWAP: Honest Settings & Strategy Guide (2026)
Affiliate Disclosure: This article contains affiliate links. If you sign up for TradingView through a link on this page, I may earn a commission at no extra cost to you. I only recommend tools I have researched and believe are relevant to the reader’s use case.
Trading involves risk. This article is for educational purposes only and is not financial advice. Technical analysis tools do not guarantee profitable results. Past performance is not indicative of future results. Always manage your risk appropriately.
Last verified: August 2026, using TradingView’s official documentation and indicator library.
TradingView VWAP gives retail traders access to one of the most important execution benchmarks institutional trading desks use, and both VWAP and Anchored VWAP are available on TradingView’s indicator and drawing tools — always verify current plan feature access at tradingview.com/pricing. I am Andreas Maratheftis, and after 30 years in professional finance I can tell you that most retail traders misuse VWAP — they treat it as a simple support and resistance line when it was designed as something entirely different: a measure of whether you are trading better or worse than the average market participant that day. This guide covers exactly how to add VWAP on TradingView, what the settings actually mean, how anchored VWAP extends its usefulness beyond a single session, and the honest limitation that causes most VWAP-based strategies to underperform.
Key Takeaways
- VWAP is a free, built-in TradingView indicator originally designed as an institutional execution benchmark, not a directional prediction tool
- Price above VWAP suggests bullish control for the session; price below suggests bearish control — it resets by default at the start of each session
- Anchored VWAP is a separate drawing tool that lets you start the calculation from any chosen point, useful for swing and event-based analysis
- VWAP is most effective combined with a second confirming signal — RSI, EMA, MACD, or Volume Profile — not used alone
- It is a lagging, backward-looking calculation — it measures where the average price has been, not where price is going next
Quick Answer
VWAP (Volume Weighted Average Price) calculates the average price of an asset weighted by the volume traded at each price level, resetting at the start of each trading session by default. On TradingView, add it through the Indicators menu — search “VWAP” and select the built-in Volume Weighted Average Price indicator. Price trading above VWAP suggests bullish control for the session; price below suggests bearish control. VWAP only displays on intraday timeframes by default. For multi-day or event-based analysis, the anchored variant — a separate drawing tool — lets you start the calculation from any point you choose, such as an earnings date or a specific swing low.
Open TradingView free and add VWAP to any intraday chart today.
What VWAP Is and Why Institutions Use It
VWAP stands for Volume Weighted Average Price. The formula is straightforward: cumulative (typical price × volume) divided by cumulative volume, calculated continuously from the start of the session. Unlike a simple moving average that treats every price equally regardless of how much volume traded there, VWAP gives more weight to price levels where the most trading actually occurred.
This distinction matters because VWAP was not originally designed as a retail trading signal. It began as an institutional execution benchmark. When a pension fund or asset manager needs to buy 500,000 shares of a stock over the course of a day, the trader executing that order is graded against VWAP. Filling below VWAP on a buy order means the desk achieved a better-than-average price. Filling above VWAP means underperformance relative to the day’s average participant. This is why it appears on every professional trading desk’s screen — it answers the question “did we execute well today?” not “where will price go next?”
Understanding this origin changes how you should use VWAP. It is a benchmark for measuring execution quality and identifying the balance of control between buyers and sellers — not a crystal ball for predicting direction.
How to Add VWAP on TradingView
Adding VWAP takes three clicks. At the time of writing, VWAP is available inside TradingView’s indicator tools, but always verify current plan access and chart limits inside your account or on TradingView’s pricing page.
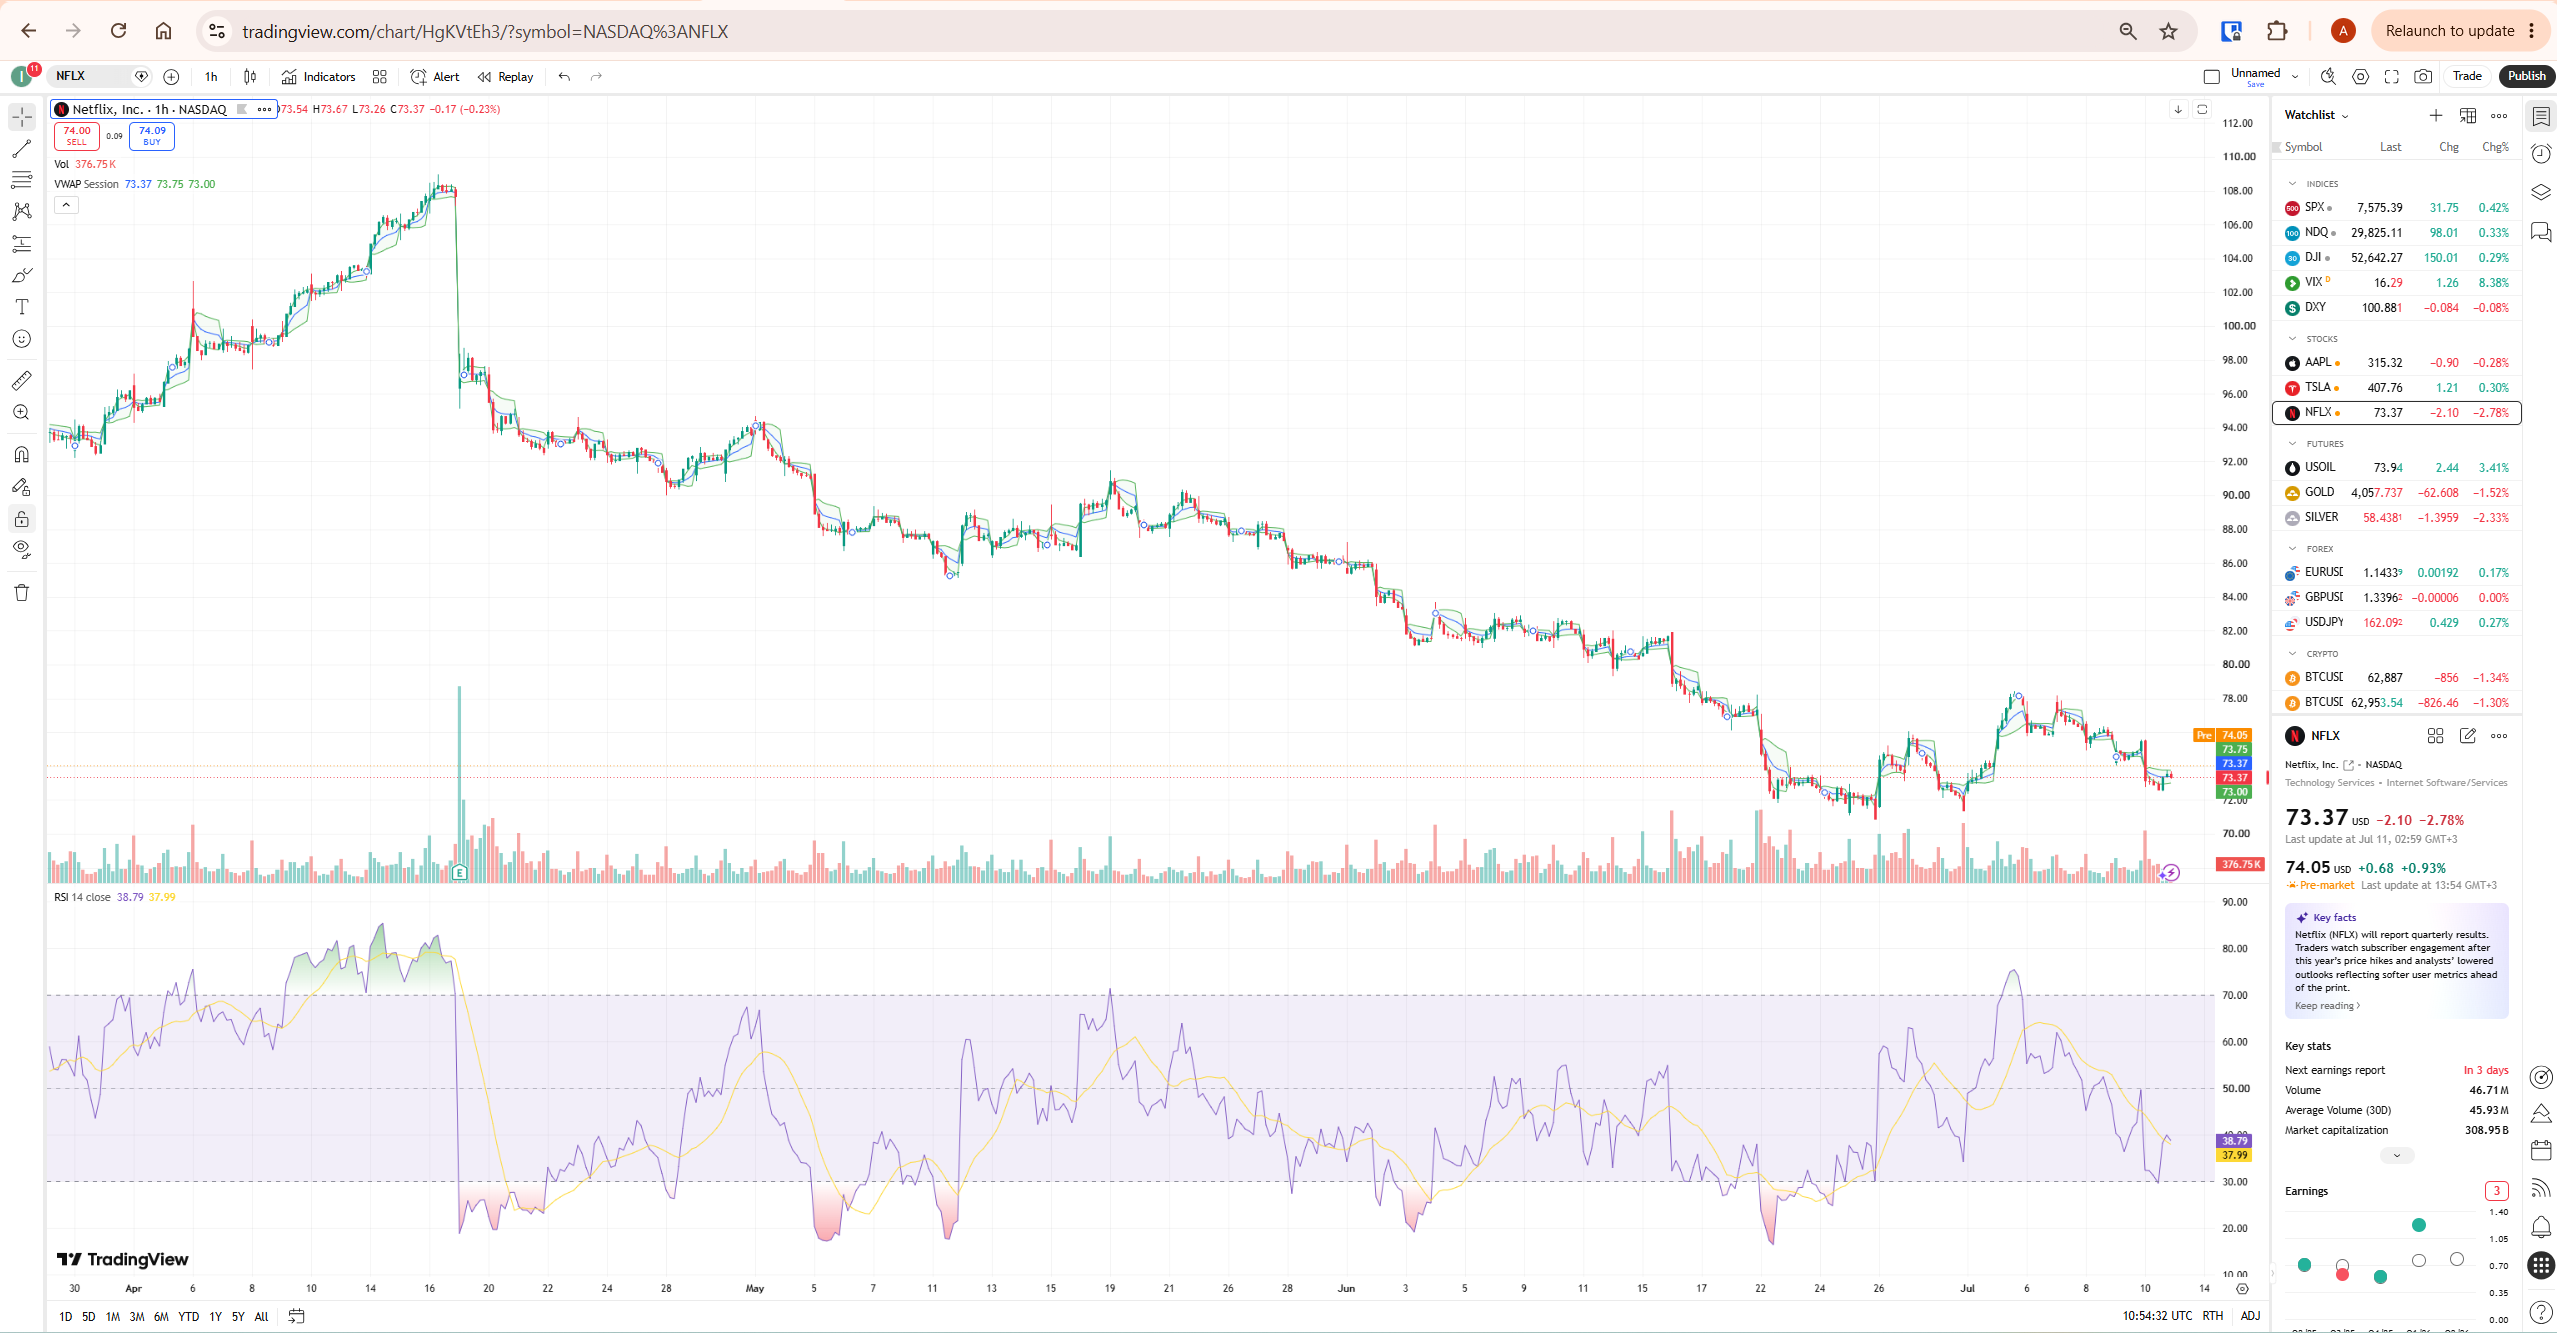
- Open any chart on TradingView and switch to an intraday timeframe — 1-minute through 1-hour work best (VWAP only displays by default on intraday charts)
- Click the Indicators button in the top toolbar
- Type “VWAP” in the search box and select Volume Weighted Average Price (VWAP) from the Technicals section
The line appears immediately, running through your chart from the session open. On most charts it renders as an orange or coloured line distinct from the candlesticks. It recalculates in real time as new price and volume data arrives and resets automatically at the start of the next session.
TradingView VWAP Settings Explained
Right-click the line and select Settings to access the configuration panel. Most traders never open this panel, which means they are running VWAP with defaults that may not suit their instrument or strategy.
| Setting | Default | What It Does | When to Change It |
|---|---|---|---|
| Anchor | Session | Determines when the calculation resets — Session, Week, Month, Quarter, Year and, where supported, event-based anchors such as Earnings, Dividends, or Splits | Switch to Week or Month for swing analysis spanning multiple sessions |
| Source | hlc3 (average of High, Low, Close) | The price input used in the VWAP calculation | Leave at default unless you have a specific reason to change it |
| Bands Multiplier 1 / 2 / 3 | Often disabled or hidden until enabled, depending on the indicator version and chart configuration | Standard deviation envelopes plotted above and below the line | Enable all three to visualise compression and expansion of price relative to VWAP |
| Offset | 0 | Shifts the line forward or backward relative to current price | Rarely changed — leave at 0 for standard analysis |
The Anchor setting is the most important one to understand — it controls when the calculation resets. On a 1-minute or 5-minute chart, Session anchor gives you the standard intraday VWAP that resets every day — this is what most day traders use. If you want to plot VWAP on a daily chart to see a full month’s volume-weighted average, switching the anchor to Month or Quarter is necessary; leaving it on Session on a daily chart produces a nearly meaningless result because the anchor resets every single bar.
Anchored VWAP: The Tool Most Traders Miss
The standard version is bound by the start and end of each trading session — useful for intraday execution but limited for swing or event-based analysis. The anchored version solves this by letting you set the starting point wherever you choose.
On TradingView, Anchored VWAP is a drawing tool, not a standard indicator, so it lives in the left-side drawing toolbar rather than the Indicators menu. This distinction matters when searching for it — if you only look under Indicators, you will not find it.
- Select the timeframe you want to analyse — daily or weekly charts work well for swing-length anchored VWAP
- Find the Anchored VWAP tool in the left drawing toolbar, typically grouped with other volume-based tools
- Click on the exact bar you want to anchor to — a significant swing low, a swing high, an earnings date, or any event you consider structurally important
- The VWAP line begins calculating from that point forward and continues until you remove or reposition it
Common anchor points include the first candle after an earnings release (to track institutional accumulation or distribution since the news), the low of a major sell-off (to see whether buyers have absorbed more volume than sellers since that point), or the start of a new calendar year. Each anchor answers a different question: “What has the average price been since this specific moment mattered?”
For traders combining the anchored version with structural price levels, our TradingView Volume Profile guide covers a complementary tool that shows where volume concentrated at specific price levels rather than as a running average.
How to Read VWAP: Three Core Signals
Reading it correctly comes down to three questions: where is price relative to VWAP, how is price interacting with VWAP, and what do the standard deviation bands show about how far price has extended.
| What You See | What It Signals | How to Use It |
|---|---|---|
| Price consistently above VWAP | Buyers in control for the session — bullish bias | Favour long setups; treat VWAP as dynamic support on pullbacks |
| Price consistently below VWAP | Sellers in control for the session — bearish bias | Favour short setups; treat VWAP as dynamic resistance on bounces |
| Price crossing back and forth through VWAP repeatedly | Balanced, choppy session with no clear directional control | Reduce position size or wait for a clearer directional break |
| Price touching VWAP and bouncing (pullback entry) | Institutional buyers/sellers stepping in at the average price | A common entry technique — enter in the direction of the prevailing trend on the VWAP touch |
| Price reaching the 2nd or 3rd standard deviation band | Price has extended significantly from the average — potentially overextended | Watch for mean-reversion setups back toward VWAP, with confirmation |
The pullback-to-VWAP entry is one of the most widely used VWAP-based setups. The logic: in a trending session, price above VWAP that pulls back to touch the line and then resumes the trend may suggest buyers are willing to support price near the session’s volume-weighted average. The same logic applies in reverse for downtrends touching VWAP from below.
How to Combine VWAP with Other Indicators
VWAP is rarely used alone in professional practice. It is most effective as one layer in a confluence-based approach.
VWAP and EMA: A common combination pairs it with a short-period EMA (commonly 9 or 20 period). When the EMA crosses above VWAP with price also above both, that alignment suggests strengthening bullish momentum. When the EMA crosses back below VWAP, it often signals the trend losing steam. This crossover approach gives a clearer signal than watching price-to-VWAP alone.
VWAP and RSI: Using RSI to confirm whether a pullback entry has momentum behind it reduces false signals. A pullback to VWAP with RSI holding above 50 in an uptrend carries more weight than the same pullback with RSI diverging or dropping toward oversold. See our TradingView RSI Divergence guide for how to spot momentum warnings that complement VWAP analysis.
VWAP and MACD: Confirming a VWAP pullback entry with a matching MACD crossover adds a momentum-confirmation layer distinct from RSI — when price, VWAP, and MACD all agree on direction, the setup carries more conviction than any single signal alone. See our TradingView MACD guide for the full setup.
VWAP and Volume Profile: It shows the running average; Volume Profile shows where volume concentrated at specific price levels historically. When VWAP aligns with a high-volume node from Volume Profile, that confluence zone carries more structural significance than either tool alone.
Setting VWAP Alerts on TradingView
Rather than watching every price interaction manually, TradingView’s alert system can notify you when price approaches or crosses VWAP.
- Add VWAP to your chart
- Right-click the line and select Add Alert
- Set the condition to Crossing and select the plot as the reference
- Choose your notification method — push, email, or webhook depending on your plan
- Set frequency to Once Per Bar Close to avoid repeated alerts during choppy price action right at the line
For the complete alert setup process across all TradingView plans, see our TradingView Alerts Explained guide.
Using VWAP for Crypto Trading on TradingView
VWAP applies differently to crypto than to stocks because crypto markets trade 24 hours a day with no formal session open or close. On TradingView, the Session anchor for crypto typically resets at midnight UTC by default, which may not align with the trading hours that matter most to your strategy.
Many crypto traders instead use Anchored VWAP tied to a specific event — the start of a major news cycle, a liquidation cascade low, or a defined multi-day range — rather than relying on the default midnight reset. Because crypto volume is fragmented across dozens of exchanges, the value calculated on TradingView reflects only the volume from the specific exchange feed you have selected, not a true aggregate of global crypto volume. This is worth keeping in mind when comparing levels across different crypto data sources.
Common VWAP Mistakes on TradingView
The most common mistake is using Session anchor on a daily or weekly chart. Because Session anchor resets at the start of each new bar’s period on higher timeframes, this indicator on a daily chart with Session anchor produces a value nearly identical to that day’s typical price — not a meaningful multi-day average. Switch the anchor to Week, Month, or Quarter for any analysis beyond a single intraday session.
The second mistake is treating every touch as an automatic entry signal. VWAP is one input, not a complete trading system. A pullback in a strong downtrend does not guarantee a bounce — it may simply be a brief pause before the trend continues. Confirmation from price action or a secondary indicator improves the reliability of any such entry.
The third mistake is ignoring how much lag this indicator carries later in the session. Because it is a cumulative average from the session open, it becomes progressively less responsive to new price action as the day progresses. A sharp reversal at 3pm has far less immediate effect on VWAP than the same move at 10am, simply because VWAP by 3pm has accumulated hours of prior data. Traders sometimes mistake this lag for a lack of momentum when it is actually a mathematical property of the indicator.
The fourth mistake is comparing VWAP across different exchanges or data feeds as if they represent the same underlying calculation. The value on a stock reflects volume from the specific exchange feed selected. The value on a crypto pair reflects only that exchange’s reported volume. Comparing levels across two different data sources without accounting for this can produce misleading conclusions.
Honest Limitation: When VWAP Fails
This is a lagging, backward-looking calculation. It tells you the average price paid so far — it does not predict where price goes next. In a strongly trending market, price can remain persistently above or below it for the entire session without ever reverting to it, which means traders waiting for a pullback that never comes miss the move entirely.
The deeper limitation is that its usefulness as an execution benchmark does not automatically translate into a reliable predictive signal. Institutions use VWAP to grade their own execution after the fact, not to forecast future price direction. Retail traders who apply this as a forward-looking signal are using the tool for a purpose it was not originally built for. This does not make it useless — the price-above/below framework for gauging session control remains genuinely useful — but it does mean this alone is not a complete trading edge.
The standard deviation bands compound this limitation. They are calculated from the same cumulative dataset as the line itself, so extreme readings on the bands reflect what has already happened in the session, not necessarily what will happen next. A price touching the third standard deviation band can continue extending well beyond it in a strongly trending or news-driven session.
For deeper context on how this fits into institutional execution frameworks, Investopedia’s guide covers the calculation and its institutional origins clearly. For a broader perspective on these trading approaches, BabyPips covers the strategy fundamentals in practical detail.
What To Do Next
Before turning a VWAP idea into a live strategy, review it on historical charts and, where possible, test the rules systematically. Our TradingView Strategy Tester guide explains how to evaluate rule-based setups before risking real capital.
Open TradingView on an instrument you follow regularly and add this indicator to a 5-minute or 15-minute chart. Watch how price interacts with the line over one full trading session without acting on any signal. Note whether price stays predominantly above, below, or oscillates around VWAP, and whether any pullback moments produced a genuine bounce or continued through. Do this across three to five sessions before incorporating this into any live trading decision. That observation period will show you exactly how it behaves on your specific instrument and timeframe.
Create a free TradingView account to add VWAP and anchored VWAP to your charts at no cost.
Related TradingView Guides
- TradingView MACD — combining momentum confirmation with VWAP pullback entries
- TradingView Volume Profile — combining VWAP with structural volume levels for stronger confluence
- TradingView RSI Divergence — confirming VWAP pullback entries with momentum signals
- TradingView Alerts Explained — how to automate VWAP crossing alerts
- TradingView Drawing Tools — where to find Anchored VWAP and other drawing-based tools
- TradingView Review 2026 — complete platform overview
Frequently Asked Questions
What is VWAP on TradingView?
VWAP (Volume Weighted Average Price) is a built-in TradingView indicator that calculates the average price of an asset weighted by volume, typically resetting at the start of each trading session. It was originally developed as an institutional benchmark for measuring trade execution quality and is now widely used by retail traders to gauge whether buyers or sellers are in control during a session. It is available free on all TradingView plans including Basic.
How do I add VWAP on TradingView?
Click the Indicators button in the top toolbar of any TradingView chart, type “VWAP” in the search box, and select Volume Weighted Average Price (VWAP) from the Technicals section. The line appears immediately on your chart. VWAP only displays by default on intraday timeframes — 1-minute through 1-hour charts — because it is designed to track price relative to a single trading session.
Is VWAP good for day trading?
Yes, VWAP is one of the most widely used tools among day traders because it directly reflects the volume-weighted average price for the current session — the same benchmark institutional desks use. Price above VWAP suggests buyers are in control for the day; price below suggests sellers are in control. It works best combined with other confirmation tools such as RSI or a short-period EMA rather than used as a standalone entry signal.
What is anchored VWAP?
Anchored VWAP is a TradingView drawing tool — found in the left toolbar, not the Indicators menu — that lets you start the VWAP calculation from any point you choose rather than the automatic session open. Common anchor points include an earnings date, a major swing low or high, or the start of a specific news event. This makes it useful for swing trading and multi-day analysis, where the standard session-based VWAP resets too frequently to be meaningful.
Does VWAP work on the TradingView free plan?
Yes. At the time of writing, VWAP and Anchored VWAP are available to TradingView users, with paid plans mainly affecting workflow limits such as indicators per chart, concurrent alerts, saved layouts, and webhook access. Plan packaging can change, so verify current VWAP and Anchored VWAP availability directly inside your account or on TradingView’s pricing page before relying on a specific plan.
What is the best VWAP strategy?
There is no single best strategy, but the most widely used approach combines the prevailing trend direction with a pullback to VWAP as an entry trigger, confirmed by price action or a momentum indicator like RSI. In an uptrend, price pulling back to touch VWAP and then resuming upward is treated as a continuation entry. The standard deviation bands add context — price reaching the second or third band suggests an extended move that may be due for mean reversion, though this should be confirmed rather than assumed.
Can VWAP be used for crypto trading on TradingView?
Yes, VWAP works on crypto charts on TradingView, but the 24/7 nature of crypto markets means the default Session anchor — which typically resets at midnight UTC — may not align with the periods that matter most to your strategy. Many crypto traders use Anchored VWAP instead, tied to a specific event such as a liquidation cascade low or the start of a defined trading range. It is also worth noting that VWAP reflects volume only from the specific exchange feed selected, not an aggregate of all global crypto trading volume.
Trading disclaimer: Trading involves risk. This article is for educational purposes only and is not financial advice. Technical analysis tools do not guarantee profitable results. Past performance is not indicative of future results. Always manage your risk appropriately.
