TradingView Free vs Paid: Which Plan Do You Need? (2026)
Affiliate Disclosure: This article contains affiliate links. If you sign up for TradingView through our link, we may earn a commission at no extra cost to you. We only recommend platforms we genuinely believe in.
The tradingview free vs paid question comes up constantly among traders who have been using the free plan and are starting to feel its limits. TradingView’s free tier is genuinely capable for basic chart reading — more so than most competing platforms offer at no cost. That makes the upgrade decision less obvious than it looks. The short answer is that the free plan works for occasional chart browsing, but it hits hard walls quickly for anyone building a real analytical workflow around it. The longer answer depends on which specific limits affect how you trade.
TradingView currently offers five plan tiers: Free, Essential, Plus, Premium, and Ultimate. Pricing ranges from $0 to $239.95 per month. The feature gaps between tiers are substantial — free users get 2 indicators per chart and no alerts on technical conditions, while Premium users get 25 indicators, 400 non-expiring alerts, and access to advanced order-flow tools that do not exist on lower plans at any price.
This tradingview free vs paid guide breaks down every meaningful difference between plans, identifies the tier boundaries that actually matter for active traders, and gives a clear verdict on which plan is worth paying for depending on how you trade. All tradingview free vs paid pricing figures are verified against TradingView’s official pricing page as of March 2026.
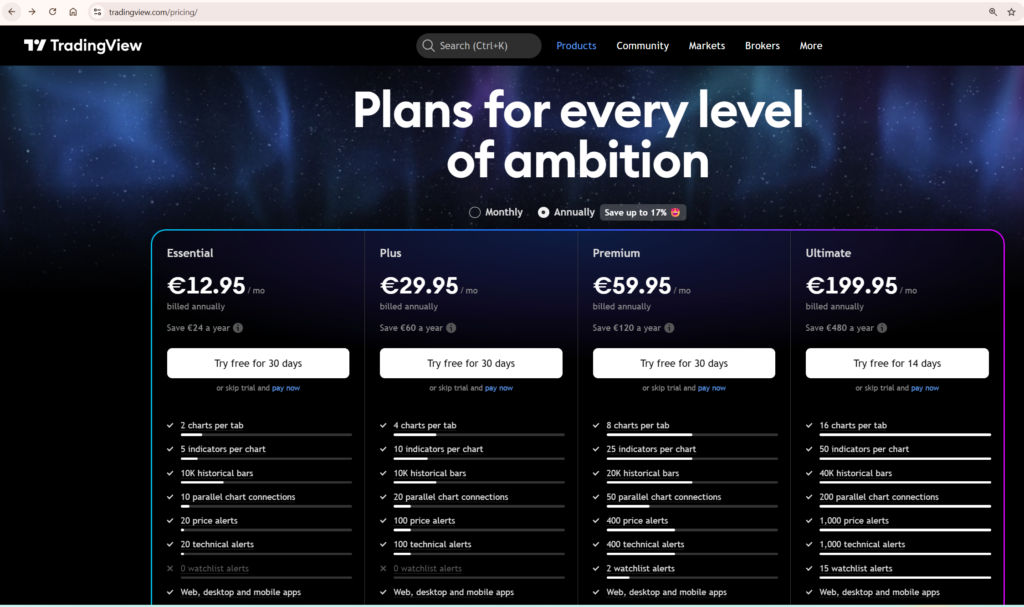
TradingView’s current paid plan tiers — Essential, Plus, Premium, and Ultimate — as displayed on the official pricing page. Prices shown in local currency at checkout. USD figures used throughout this article for consistency.
TradingView Free vs Paid: Plan Pricing in 2026
TradingView raised prices on its Plus and Premium monthly tiers in 2025 — an increase of approximately 13% that caught many existing users off guard. Annual billing remains the better value across every paid plan, with savings ranging from $24 per year on Essential to $480 per year on Ultimate. Every paid plan from Essential through Premium includes a 30-day free trial. Ultimate offers a 14-day trial. There is no reason not to test a plan before committing to it.
| Plan | Monthly billing | Annual billing (per month) | Free trial |
|---|---|---|---|
| Free | $0 | $0 | — |
| Essential | $14.95 | $12.95 | 30 days |
| Plus | $33.95 | $28.29 | 30 days |
| Premium | $67.95 | $56.49 | 30 days |
| Ultimate | $239.95 | $199.95 | 14 days |
A word of caution: many third-party review sites still list Plus at $29.95/month and Premium at $59.95/month. These figures are outdated following the 2025 price increase. Always verify current pricing directly against TradingView’s own pricing page rather than relying on older articles, including this one — platform pricing can change and we recommend confirming before subscribing.
TradingView also runs significant Black Friday promotions. Discounts of 70–80% off annual plans were reported in November 2025, making that the best window to upgrade if timing is flexible. For traders who are ready to upgrade now, every paid plan includes a free trial period — start there before paying anything.
You can explore all plan options and start a free trial through our TradingView affiliate link.
Indicators Per Chart: The Limit That Hits First
For most traders, the indicator limit is the first free plan restriction they actually feel in practice. Two indicators per chart sounds workable in theory until you realise that a moving average, an RSI, and a volume indicator already exceeds that ceiling. Anyone running even a basic multi-indicator setup will find the free plan insufficient within the first serious charting session.
This is not a hypothetical inconvenience. It is a hard block that forces you to choose between indicators every time you open a chart. For traders who rely on layered analysis — combining trend, momentum, volume, and volatility signals — the free plan simply cannot support it.
| Plan | Indicators per chart | Charts per layout | Saved layouts | Historical bars |
|---|---|---|---|---|
| Free | 2 | 1 | 1 | 5,000 |
| Essential | 5 | 2 | 5 | 10,000 |
| Plus | 10 | 4 | 10 | 10,000 |
| Premium | 25 | 8 | Unlimited | 20,000 |
| Ultimate | 50 | 16 | Unlimited | 40,000 |
Essential at five indicators per chart is a meaningful step up from free, but it still constrains traders who run layered analysis. A typical setup — trend indicator, momentum oscillator, volume indicator, volatility band, and a custom Pine Script overlay — already maxes out Essential. Plus doubles that to ten, which covers the majority of retail trading workflows comfortably. Premium’s 25 indicators per chart is where professional-grade multi-system setups become possible.
Notice that Plus and Essential share the same 10,000-bar historical data limit. This is one of the most important things to understand when comparing plans — Plus costs more than double Essential but offers no advantage in historical data depth. Premium jumps to 20,000 bars, and Ultimate reaches 40,000 bars, which covers decades of data on daily and weekly timeframes.
The multi-chart layout limit matters for traders who run simultaneous timeframe analysis. Free users get one chart per tab. Essential unlocks two. Premium’s eight charts per layout is where serious multi-timeframe workflows become genuinely practical without switching tabs constantly. For a full breakdown of how to use multiple chart layouts effectively, our guide to using multiple charts in TradingView covers every layout option and workflow.
Alerts: The Most Important Paid Feature Most Traders Underestimate
The free plan allows three price alerts and zero alerts on technical conditions or custom indicators. For any trader using TradingView seriously, this is the most crippling single limitation on the free tier. The moment you want to be notified when RSI crosses a threshold, when a moving average crossover occurs on a watchlist of twenty tickers, or when your own Pine Script condition fires — you need a paid plan. Full stop.
| Plan | Price alerts | Technical alerts | Alert duration | Webhooks | Second-based alerts |
|---|---|---|---|---|---|
| Free | 3 | 0 | 1 month | ✗ | ✗ |
| Essential | 20 | 20 | 2 months | ✓ | ✗ |
| Plus | 100 | 100 | 2 months | ✓ | ✗ |
| Premium | 400 | 400 | Never expire | ✓ | ✓ |
| Ultimate | 1,000 | 1,000 | Never expire | ✓ | ✓ |
There are two alert-related tier boundaries that traders consistently underestimate until they run into them directly.
The first is alert expiry. Essential and Plus alerts expire after two months, requiring manual recreation. Premium and Ultimate alerts never expire. For traders running automated strategies via webhooks — where alerts trigger order execution on external platforms — having alerts silently expire in the background is a serious operational risk. If you are connecting TradingView to any kind of execution system or trading bot, Premium is the minimum viable tier. An alert expiring mid-strategy is not a minor inconvenience; it means your system stops working without warning.
The second is second-based alert resolution. This only becomes available on Premium and above. For traders who need to react to short-duration conditions — particularly in crypto markets where moves can develop and reverse within minutes — minute-based alert resolution on Essential and Plus may be too slow for the strategy to function correctly. Premium’s second-based alerts bring TradingView into line with what active traders actually need.
Webhook notifications are available from Essential upward, meaning you can connect TradingView alerts to external services, bots, or trading platforms from the entry-level paid tier. For a practical breakdown of how to configure every alert type and connect them to notifications, our TradingView alerts guide covers the complete setup process.
Bar Replay: Unavailable on Free, Depth Varies on Paid
Bar Replay — the ability to step through historical price action bar by bar — is completely unavailable on the free plan. This is a significant omission for traders who use replay to practise entries and exits on historical data, or to review how a strategy would have behaved during a specific market event.
On paid plans, the available data depth for replay scales with tier. The differences matter particularly for intraday traders who want to replay minute or second-level data:
| Data granularity | Essential | Plus | Premium | Ultimate |
|---|---|---|---|---|
| Daily and above | ✓ | ✓ | ✓ | ✓ |
| Minute-level | 180 days | 365 days | All available | All available |
| Second-level | ✗ | ✗ | ✓ | ✓ |
| Tick-level | ✗ | ✗ | ✗ | 7 days |
For swing traders working on daily charts, Essential’s Bar Replay is fully adequate. For intraday traders who want to replay a full year of minute-level data, Plus covers that with its 365-day cap. For traders who need access to all available intraday history or second-level data, Premium is the correct tier.
The Bar Magnifier feature — which uses lower-timeframe data to simulate more realistic backtest order fills rather than assuming fills at bar close — is restricted to Premium and Ultimate. This makes a meaningful difference to the reliability of backtesting results. A strategy tested without Bar Magnifier may show significantly different performance metrics than one tested with it, particularly on shorter timeframes where the difference between bar open and close is substantial. Our dedicated guide to using TradingView Bar Replay walks through the full replay workflow in detail.
Pine Script Capabilities by Plan
In the tradingview free vs paid context, Pine Script is available on all plans including Free — you can write, test, and apply custom indicators without paying anything. But several Pine Script capabilities are gated behind paid tiers, and they matter significantly for serious script developers and systematic traders.
Script calculation time is the most immediately practical limit. Free users get 20 seconds of calculation time per script execution. Essential through Premium get 40 seconds. Ultimate gets 100 seconds. Complex multi-timeframe scripts or strategies that process large datasets will hit the 20-second ceiling on the free plan — producing a “Script could not be executed” error rather than a result. For traders writing anything beyond simple single-timeframe indicators, the free plan’s calculation limit becomes a genuine obstacle.
Deep Backtesting — extended historical strategy testing beyond the standard bar limit — is restricted to Premium and Ultimate. If you are using Pine Script to validate trading strategies on long historical datasets, Premium is effectively the minimum viable tier for meaningful backtesting.
The most significant new Pine Script capability in 2026 is the request.footprint() function, introduced in March 2026. This gives Premium and Ultimate users programmatic access to Volume Footprint data directly inside Pine Script — enabling custom order-flow indicators, delta divergence strategies, and volume profile analysis that previously required dedicated third-party platforms costing significantly more than TradingView’s Premium tier.
Publishing scripts publicly is available from Essential upward. Publishing invite-only scripts — the mechanism that Pine Script vendors use to sell or share proprietary indicators with paying subscribers — requires Premium or Ultimate. If you intend to build a script business on TradingView, Premium is the entry point for the tools you need.
For a complete introduction to writing Pine Script from scratch using the current v6 syntax, our Pine Script tutorial for beginners covers the full workflow including indicators, alerts, and strategy backtesting.
Volume Footprint and Advanced Order Flow Tools
Volume Footprint is TradingView’s answer to dedicated order-flow platforms. It displays traded volume broken down by price level within each bar, showing the balance between buying and selling pressure at every tick. This gives traders visibility into where institutional activity is concentrated — information that price action alone cannot reveal. Dedicated order-flow platforms that offer comparable data typically cost significantly more than TradingView’s Premium tier.
Volume Footprint charts are available exclusively on Premium and Ultimate. The feature has been progressively enhanced since its 2024 introduction — TradingView added Profile display mode, a Ladder view, a table summary overlay, and most recently the Pine Script integration via request.footprint() in March 2026. For traders who consider order-flow analysis part of their core methodology, this alone justifies the Premium price point relative to alternatives.
It is worth being clear about the distinction between Volume Profile and Volume Footprint. Volume Profile indicators — which show volume distribution across price levels over a selected period — are available from Essential upward. Volume Footprint is a different and more granular tool that shows the bid/ask breakdown within each individual bar. Both are valuable, but they answer different questions. Do not assume that having Volume Profile on Essential means you have access to the full order-flow toolkit — you do not.
Other advanced chart types restricted to Premium and Ultimate include Time Price Opportunity (TPO) charts and Volume Candles. Free, Essential, and Plus users have access to 17 customisable chart types. Premium and Ultimate unlock 21 types, adding the order-flow variants. Renko, Kagi, Point and Figure, and Range bar charts require Essential or above — they are not available on Free.
Paper Trading, Data Export, Ads, and Everything Else
Paper trading is one of TradingView’s most generous features — it is fully available on every plan including Free. Simulated trading on charts, DOM trading, and live broker connectivity for real trading are all accessible without a subscription. For traders who are evaluating TradingView as a platform before paying, the paper trading functionality is identical across all tiers and gives you a genuine feel for the platform’s execution interface.
Data export is more restrictive. Chart data download — exporting OHLCV price data as a CSV file for external analysis — requires Plus or higher. Screener and watchlist exports unlock at Essential. Strategy report export also requires Plus or above. If you run quantitative analysis on exported price data, or if you need to feed TradingView data into an external model or spreadsheet, Plus is the minimum viable plan for your workflow.
On advertising: the free plan displays ads on charts, in the social feed, and in mobile apps. All paid plans are completely ad-free. For traders who use TradingView during extended analytical sessions, the ad-free experience on even the cheapest paid tier is a noticeably cleaner working environment. This is a quality-of-life difference that is easy to underestimate until you spend several hours on the free plan.
Watchlist capacity scales significantly across tiers. Free users get one watchlist with 30 symbols. Ultimate users get unlimited watchlists with 1,000 symbols each. For traders monitoring broad market universes or running systematic screening across hundreds of instruments, the watchlist limits on Free and Essential become a practical constraint faster than expected.
Market data subscriptions for premium exchanges and alternative data feeds are unavailable on Free, capped at two on Essential, and unlimited on Ultimate. Customer support escalates from no dedicated support on Free through to First Priority response on Ultimate. For traders running live strategies where a platform issue has direct financial consequences, support tier is a legitimate consideration when choosing a plan.
The Honest Verdict: Which Plan Should You Actually Pay For?
The tradingview free vs paid decision comes down to one question: what does your actual trading workflow require? The free plan is sufficient for one specific use case — occasionally opening TradingView to look at a price chart with one or two indicators. The moment you try to build any kind of systematic analytical workflow around it, you will hit its limits within a single serious session.
Essential at $12.95/month (annual billing) is the correct entry point for paid TradingView. It removes ads, unlocks Bar Replay, enables technical alerts with webhook support, gives you five indicators per chart, opens up custom time intervals, and provides access to exotic chart types like Renko and Kagi. For a trader evaluating whether TradingView is worth paying for at all, Essential answers that question cleanly at a price that is hard to argue with.
Plus at $28.29/month is the hardest plan to justify. It doubles Essential’s indicator and chart layout limits — from 5 to 10 indicators, and from 2 to 4 charts per layout — which matters if you specifically need those higher limits. But it shares Essential’s 10,000-bar history ceiling and its two-month alert expiry. At more than double Essential’s price, Plus earns its cost only if the indicator count or layout capacity genuinely constrains your current workflow and you do not yet need Premium’s alert permanence or order-flow tools.
Premium at $56.49/month is where TradingView becomes a professional-grade platform. Non-expiring alerts, second-based alert resolution, Volume Footprint and TPO charts, Deep Backtesting with Bar Magnifier, 25 indicators per chart, 8 charts per layout, 20,000 bars of history, and the new Pine Script footprint data access — this is the tier where serious active traders and systematic traders find the platform fully capable. The 2025 price increase makes it more expensive than it was, but the feature set justifies the cost for traders who use TradingView as their primary analytical platform daily.
Ultimate at $199.95/month is priced for professionals with specific high-volume needs — tick data, 50 indicators per chart, 1,000 alerts, 40,000 bars of history, 100 seconds of Pine Script calculation time, unlimited market data subscriptions, and First Priority support. For the vast majority of retail traders, Premium covers everything they will practically use. Ultimate makes sense for quantitative traders, Pine Script vendors who need maximum calculation headroom, or multi-asset professionals who need unlimited data feed subscriptions.
The practical tradingview free vs paid decision framework: start with Essential to validate whether paid TradingView fits your workflow, then upgrade to Premium when alert expiry, indicator count, or order-flow tools become the limiting factor. Skip Plus unless you have a specific reason to stop there — the value gap between Plus and Premium is narrower than the price gap suggests.
You can compare all plans and start a 30-day free trial at TradingView. For a full assessment of what the platform offers beyond this tradingview free vs paid comparison, our TradingView review covers features, charting capabilities, broker integrations, and who the platform is best suited for. If you are evaluating TradingView against competing platforms, our comparison of TradingView vs MetaTrader breaks down the key differences for active traders across both retail and professional use cases.